In this topic, you can find information about creating an Analytics definition.
Prerequisites
Procedure
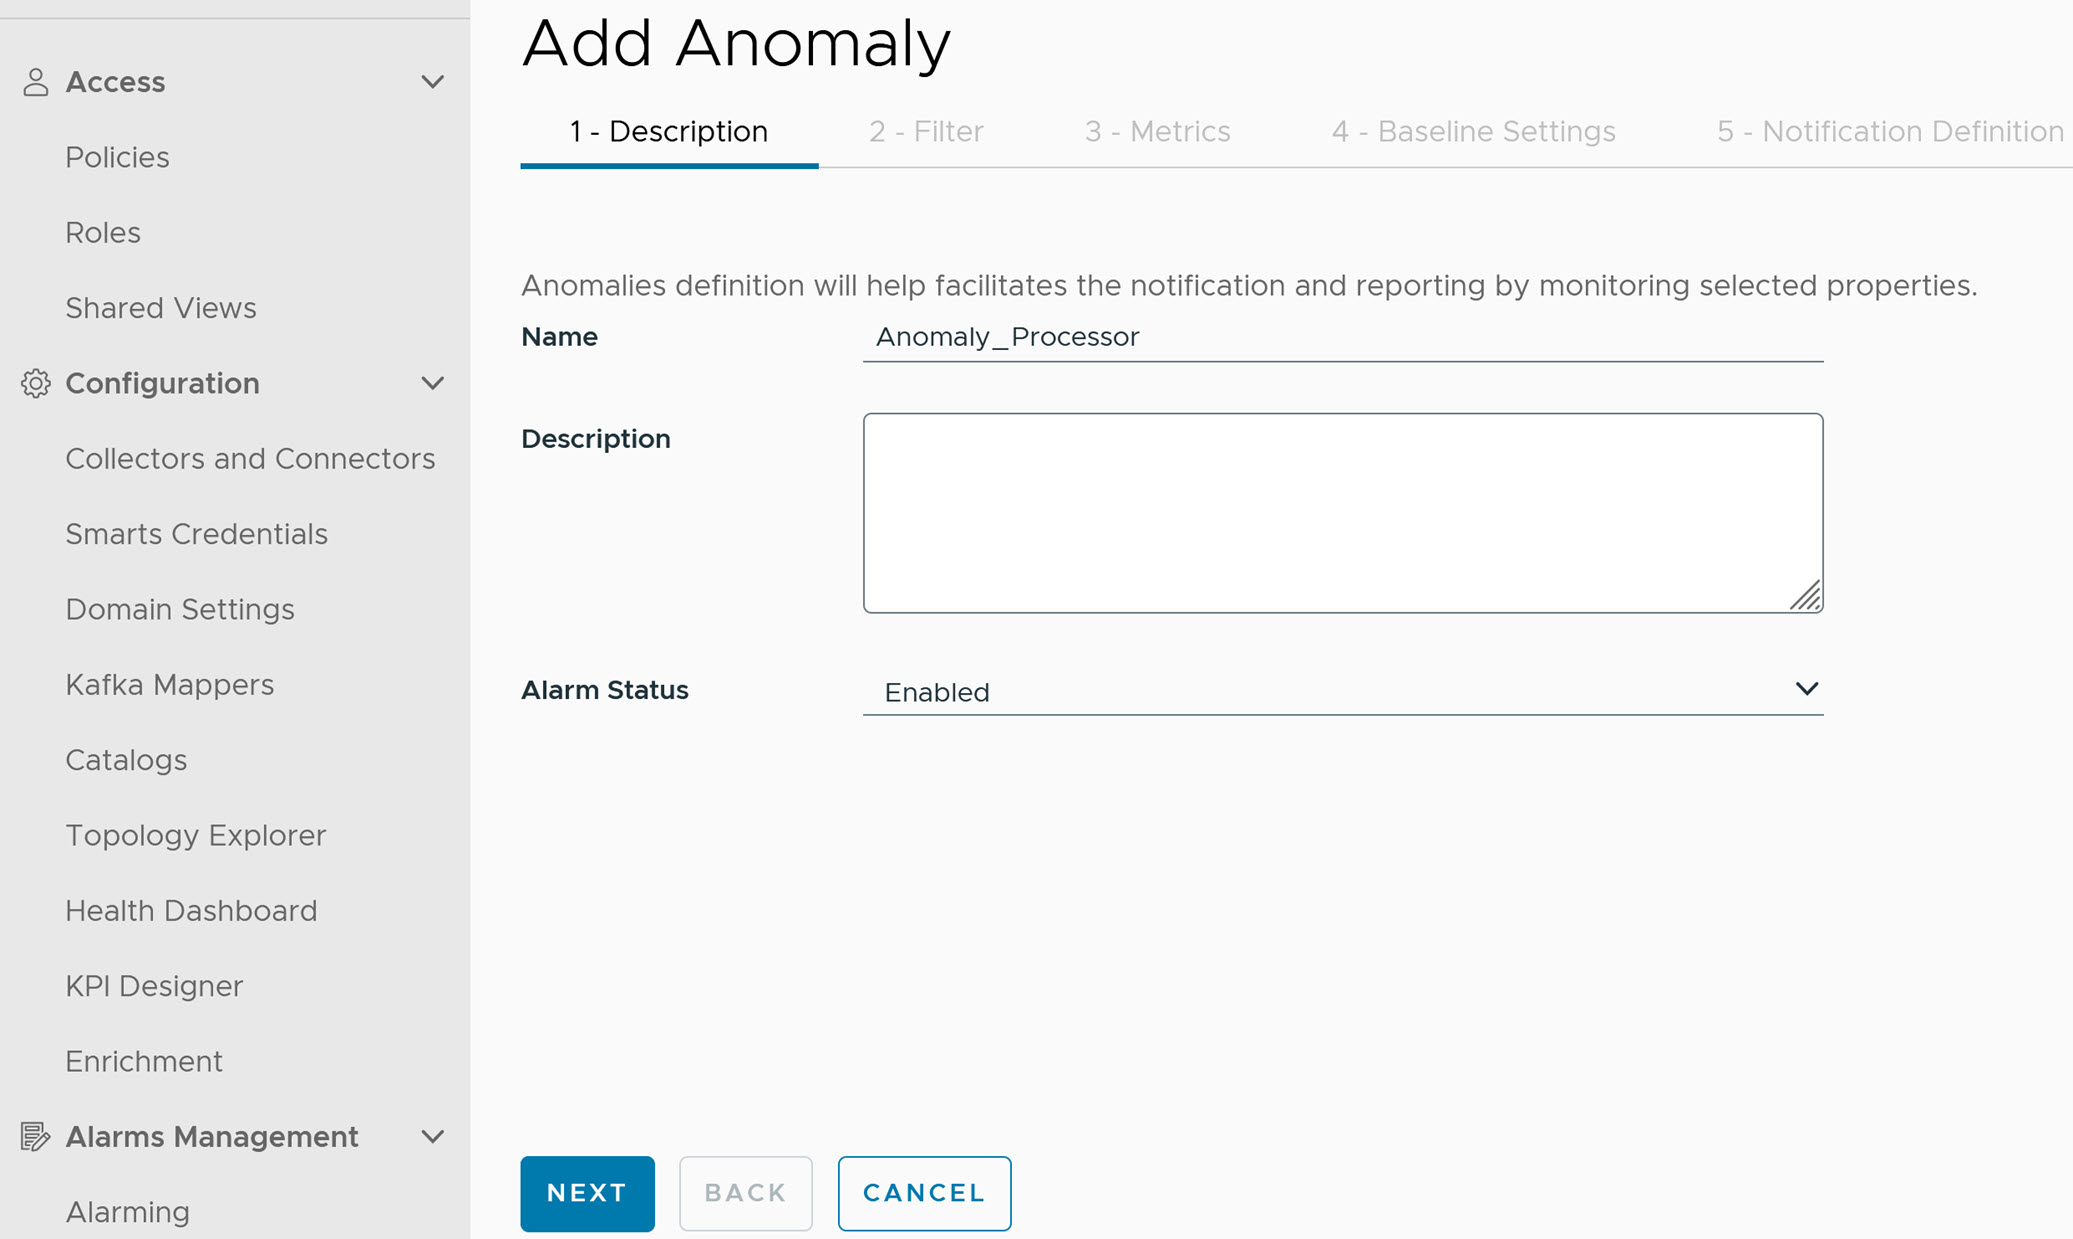
- Under Description, provide the following details:
- Name: Provide the definition name.
- Description: Provide a description for the definition when an Anomaly is detected.
- Alarm Status: Select the alarm status from the drop-down menu. Available options are:
- Enable
- Disable
Note: By default, the alarm status is disabled.
- Under Filter, select the Property, Expression, and enter the Value for the metrics.
Note: The property drop-down list contains capital letter objects followed by small letter objects.
- To add multiple filters within the same group, click Add Condition. The AND condition tag is used when you add filters within the same group.
- To add multiple filters, click Add Group. The OR condition tag is used when you add filters from different groups.
You can view the applicable metrics in the Filtered Metrics Preview grid.

Note:- Each filter group must contain an Entity type and Device type.
- The filtered metrics preview grid does not display values for units and descriptions, as the source metrics do not have them.
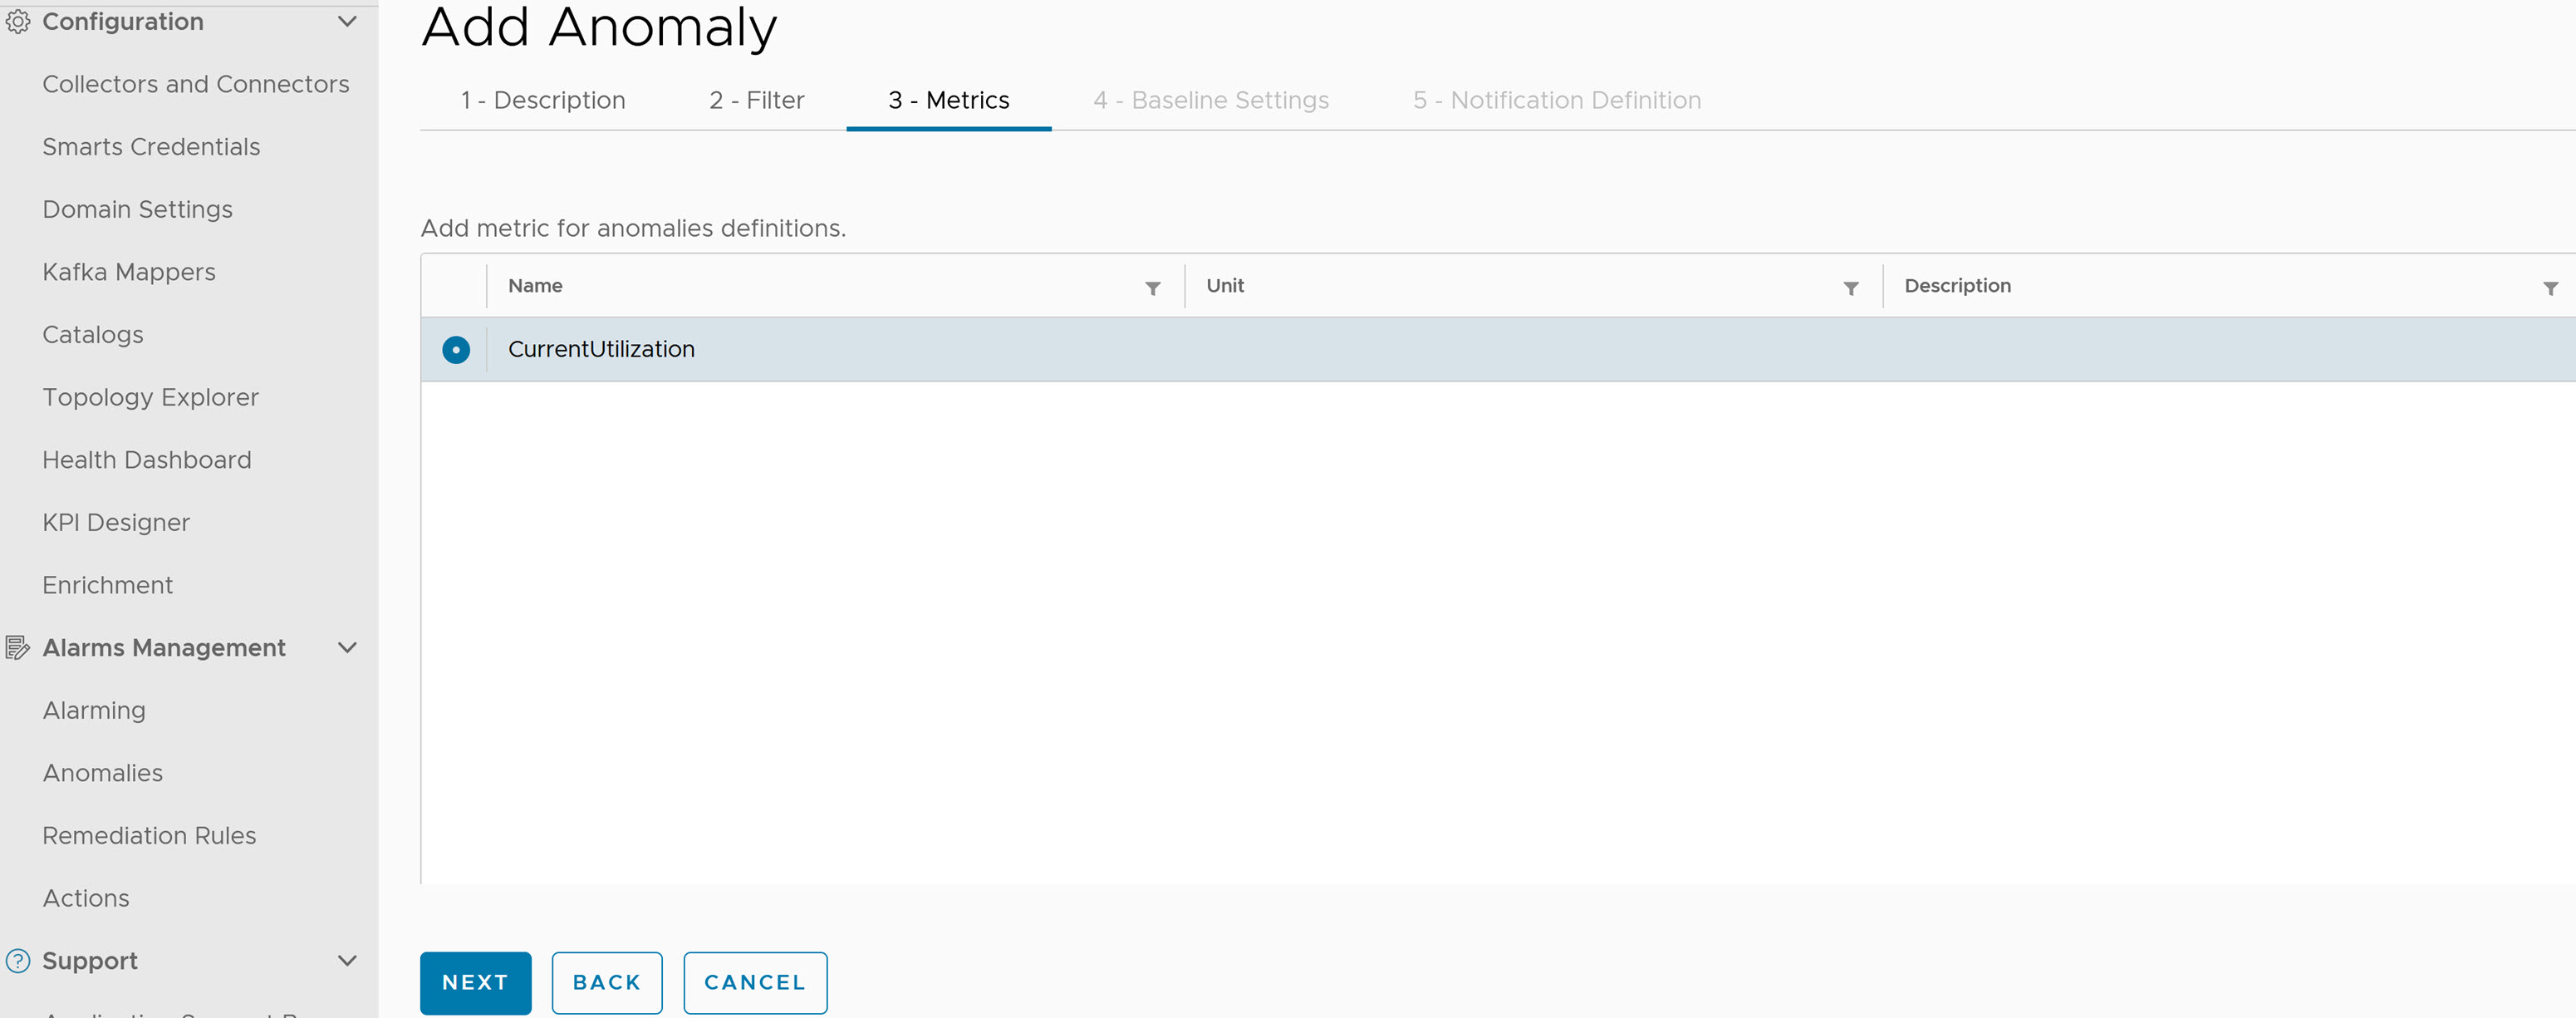
- Under Metrics, select the required metric. You can select only one metric for a single Anomaly definition.
- Under Baseline Settings, provide the following details:
- Baseline Interval: Select the baseline interval for the Anomaly data. Default is hourly.
Note: If you select Baseline Interval as hourly, then you must wait for approximately one hour to see the data.
- Consumption Rate: Provide the number of Kafka consumers which are used by the Anomaly definition while reading metric data when the definition is deployed.
- Variation Factor: Using the following formula, calculate the lower bound and upper bound for a metric. The Variation Factor input value is substituted for n to calculate the lower and upper bound.
- Upper bound = mean + n * standard deviation
- Lower bound = mean – n * standard deviation
- Where 1>= n <=3
- EnableLower class Anomaly: Acceptable options are:
- True
- False
Note: If true, Analytics Service generates the Anomaly for the metric value which is less than the lower class boundary (LCB) else lower bound is ignored. And, Analytics Service generates the Anomaly only for the metrics which is greater than the upper boundary.

- Baseline Interval: Select the baseline interval for the Anomaly data. Default is hourly.
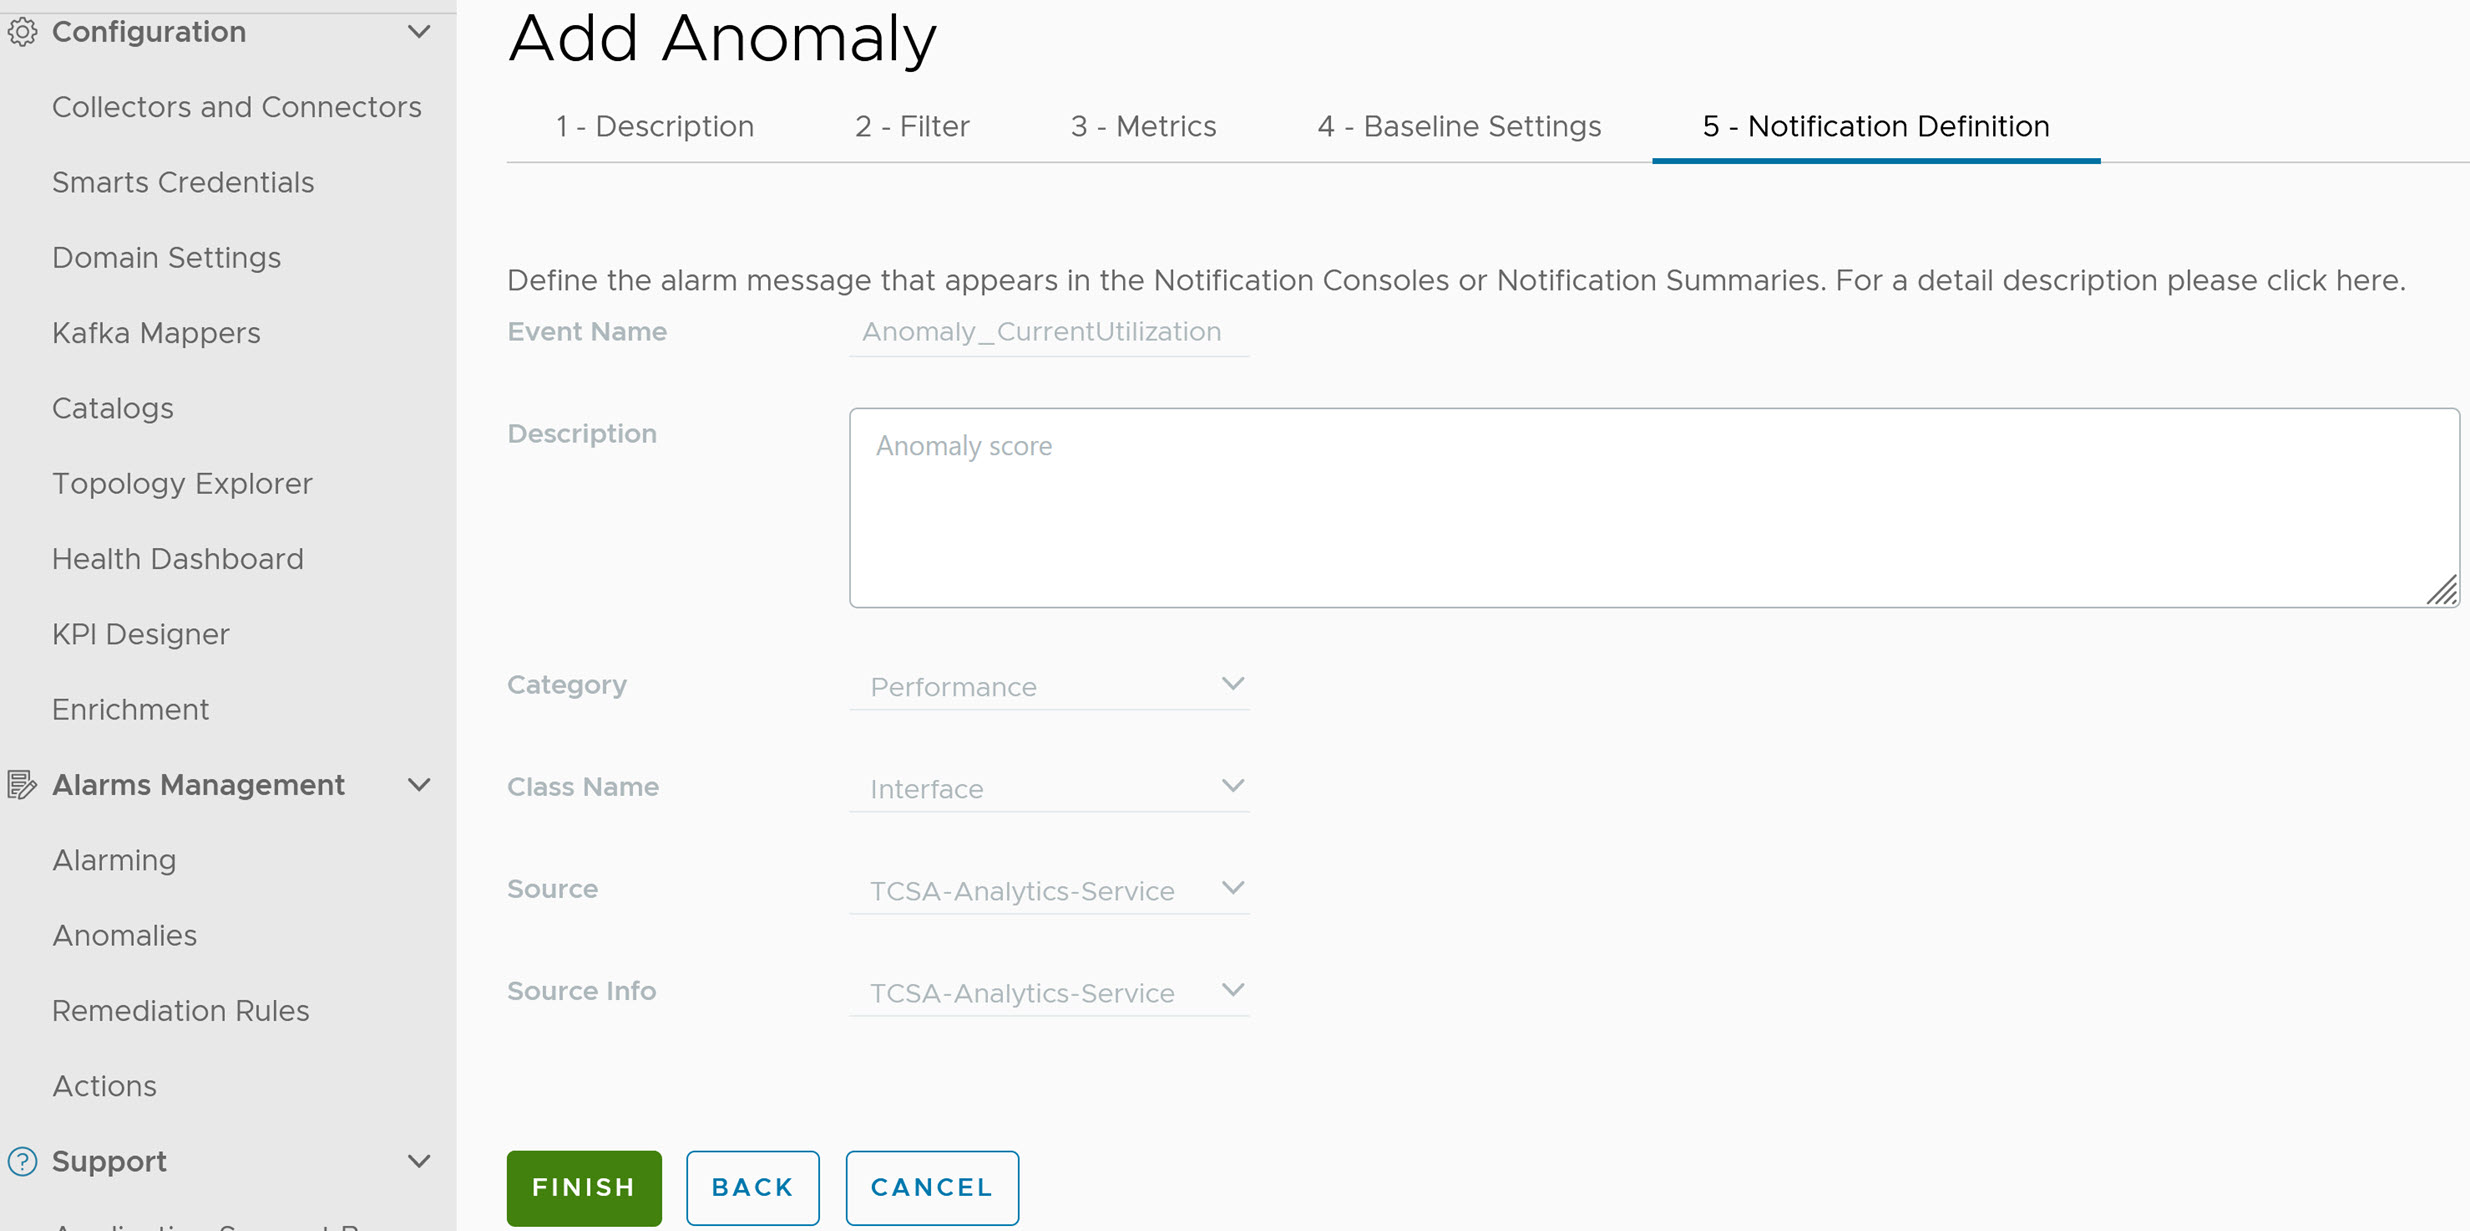
- Under Notification Definition, you can see different notification definition fields populated with alarm messages that appear in the Notification Console or Notification Summary.