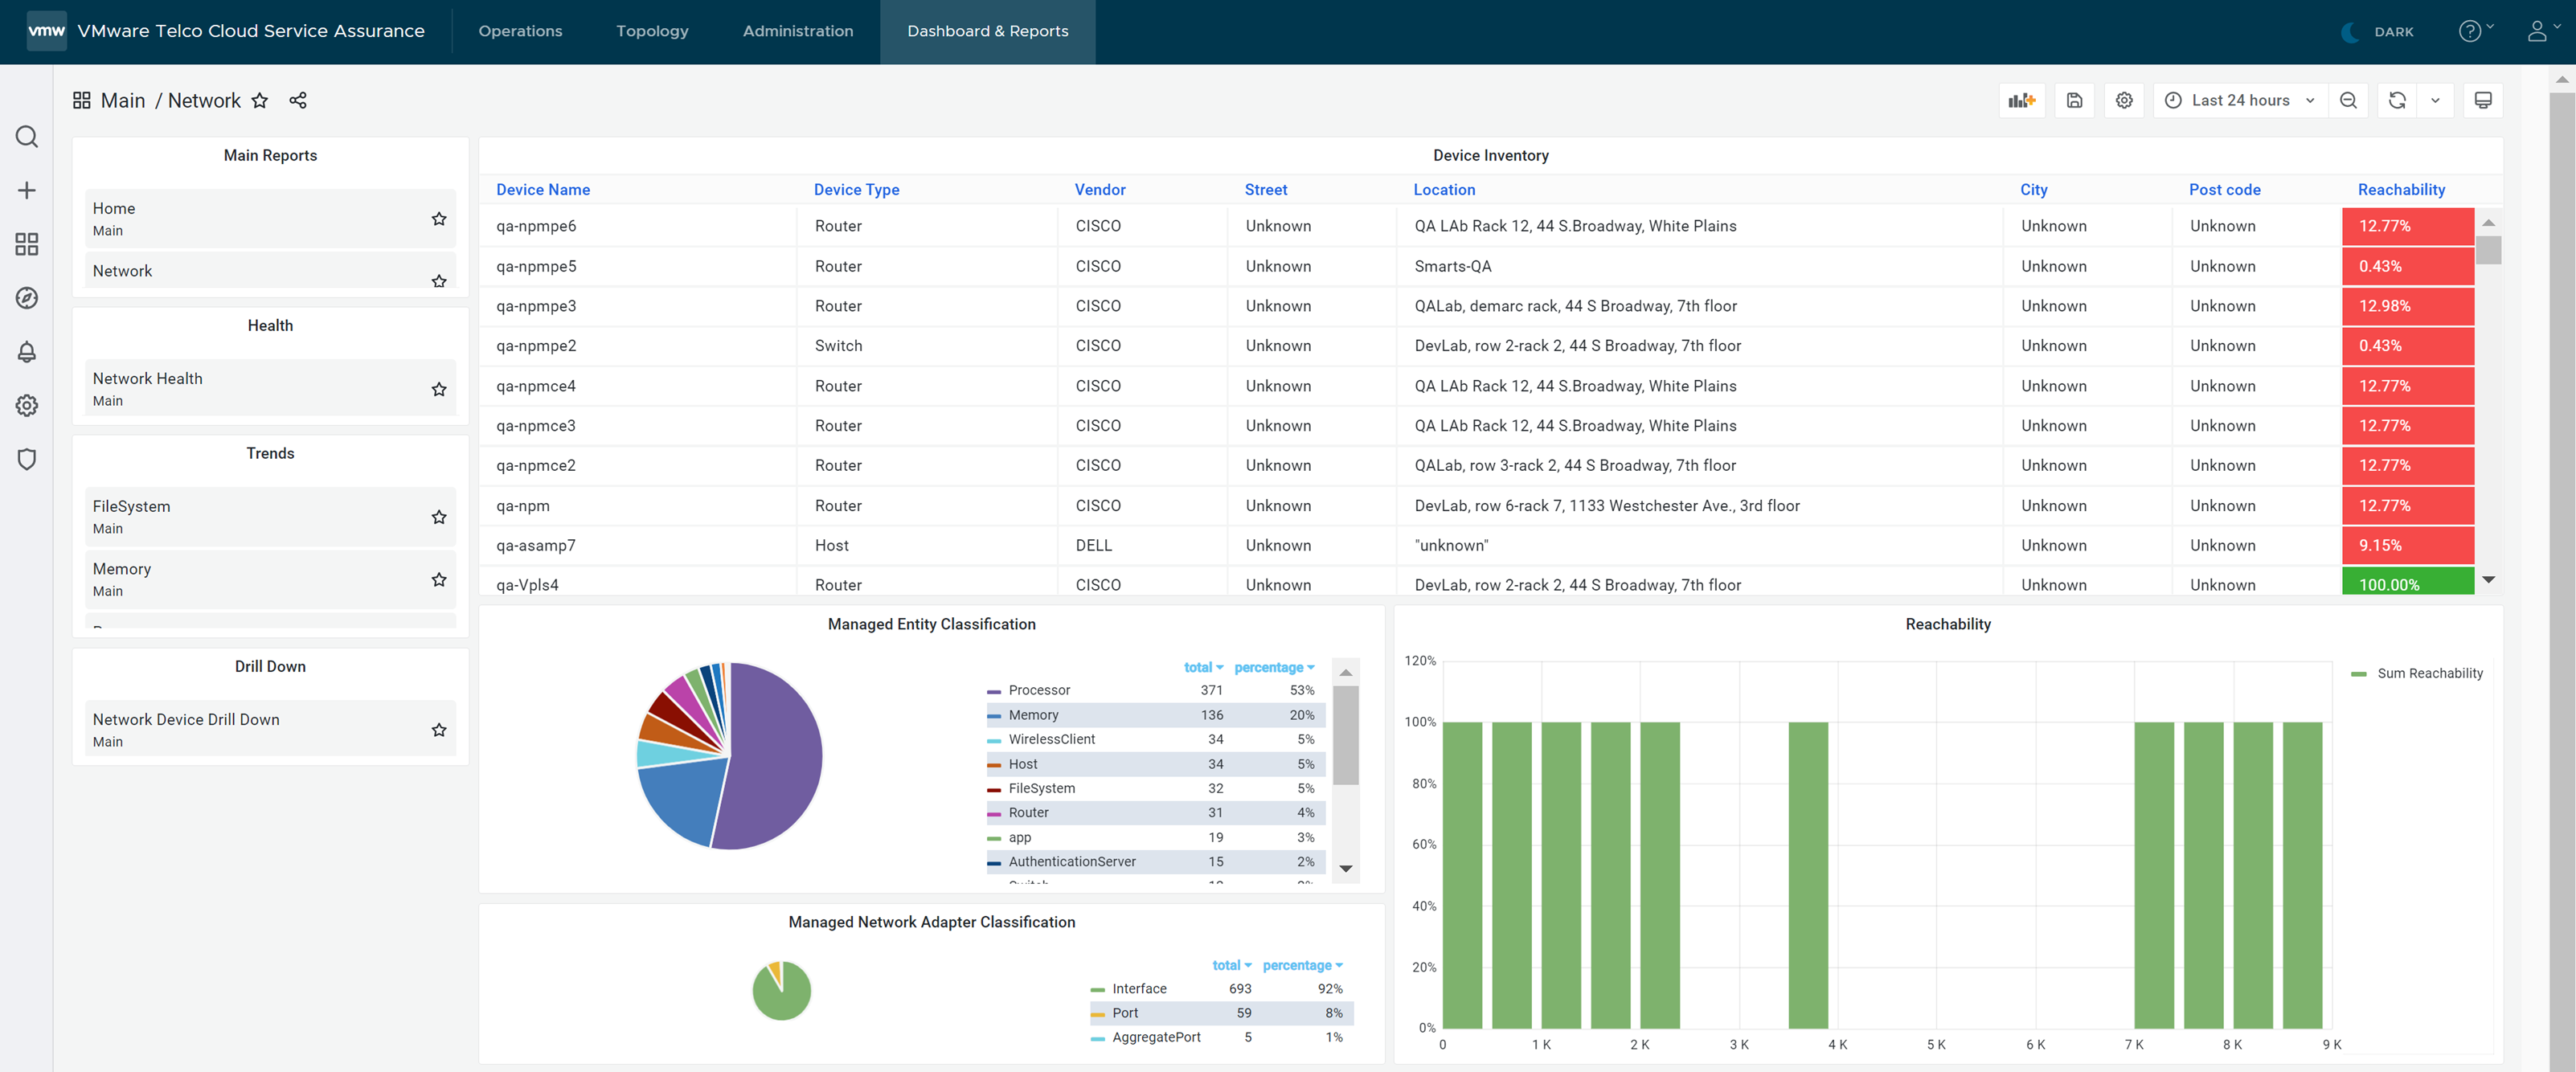
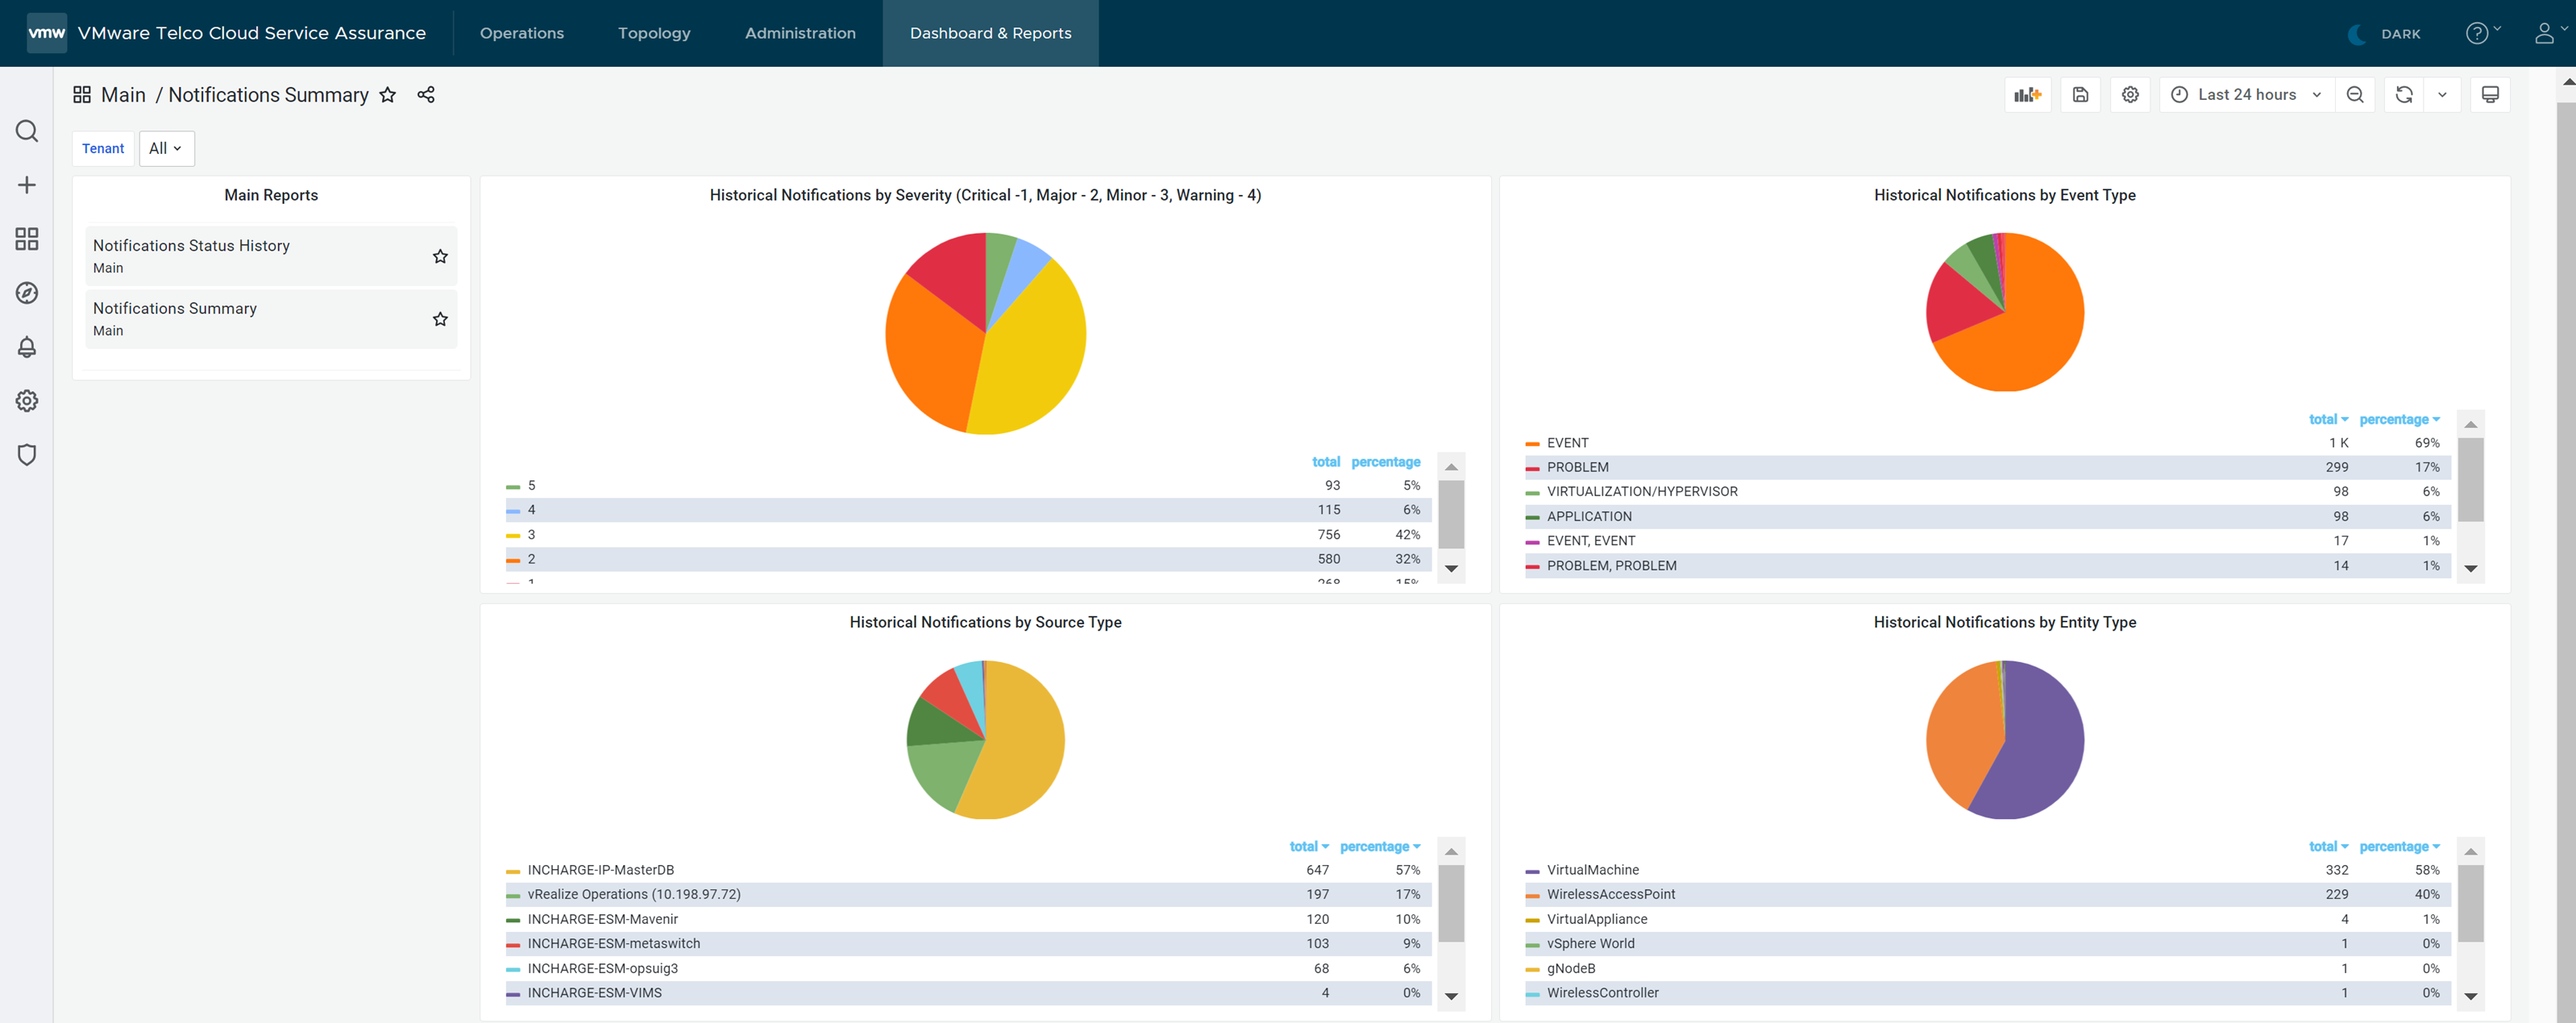
In this topic, you can find information on viewing Main reports. The Main report consists of five reports (Compute, Data Center, Home, Network, and Notifications Summary).
Procedure
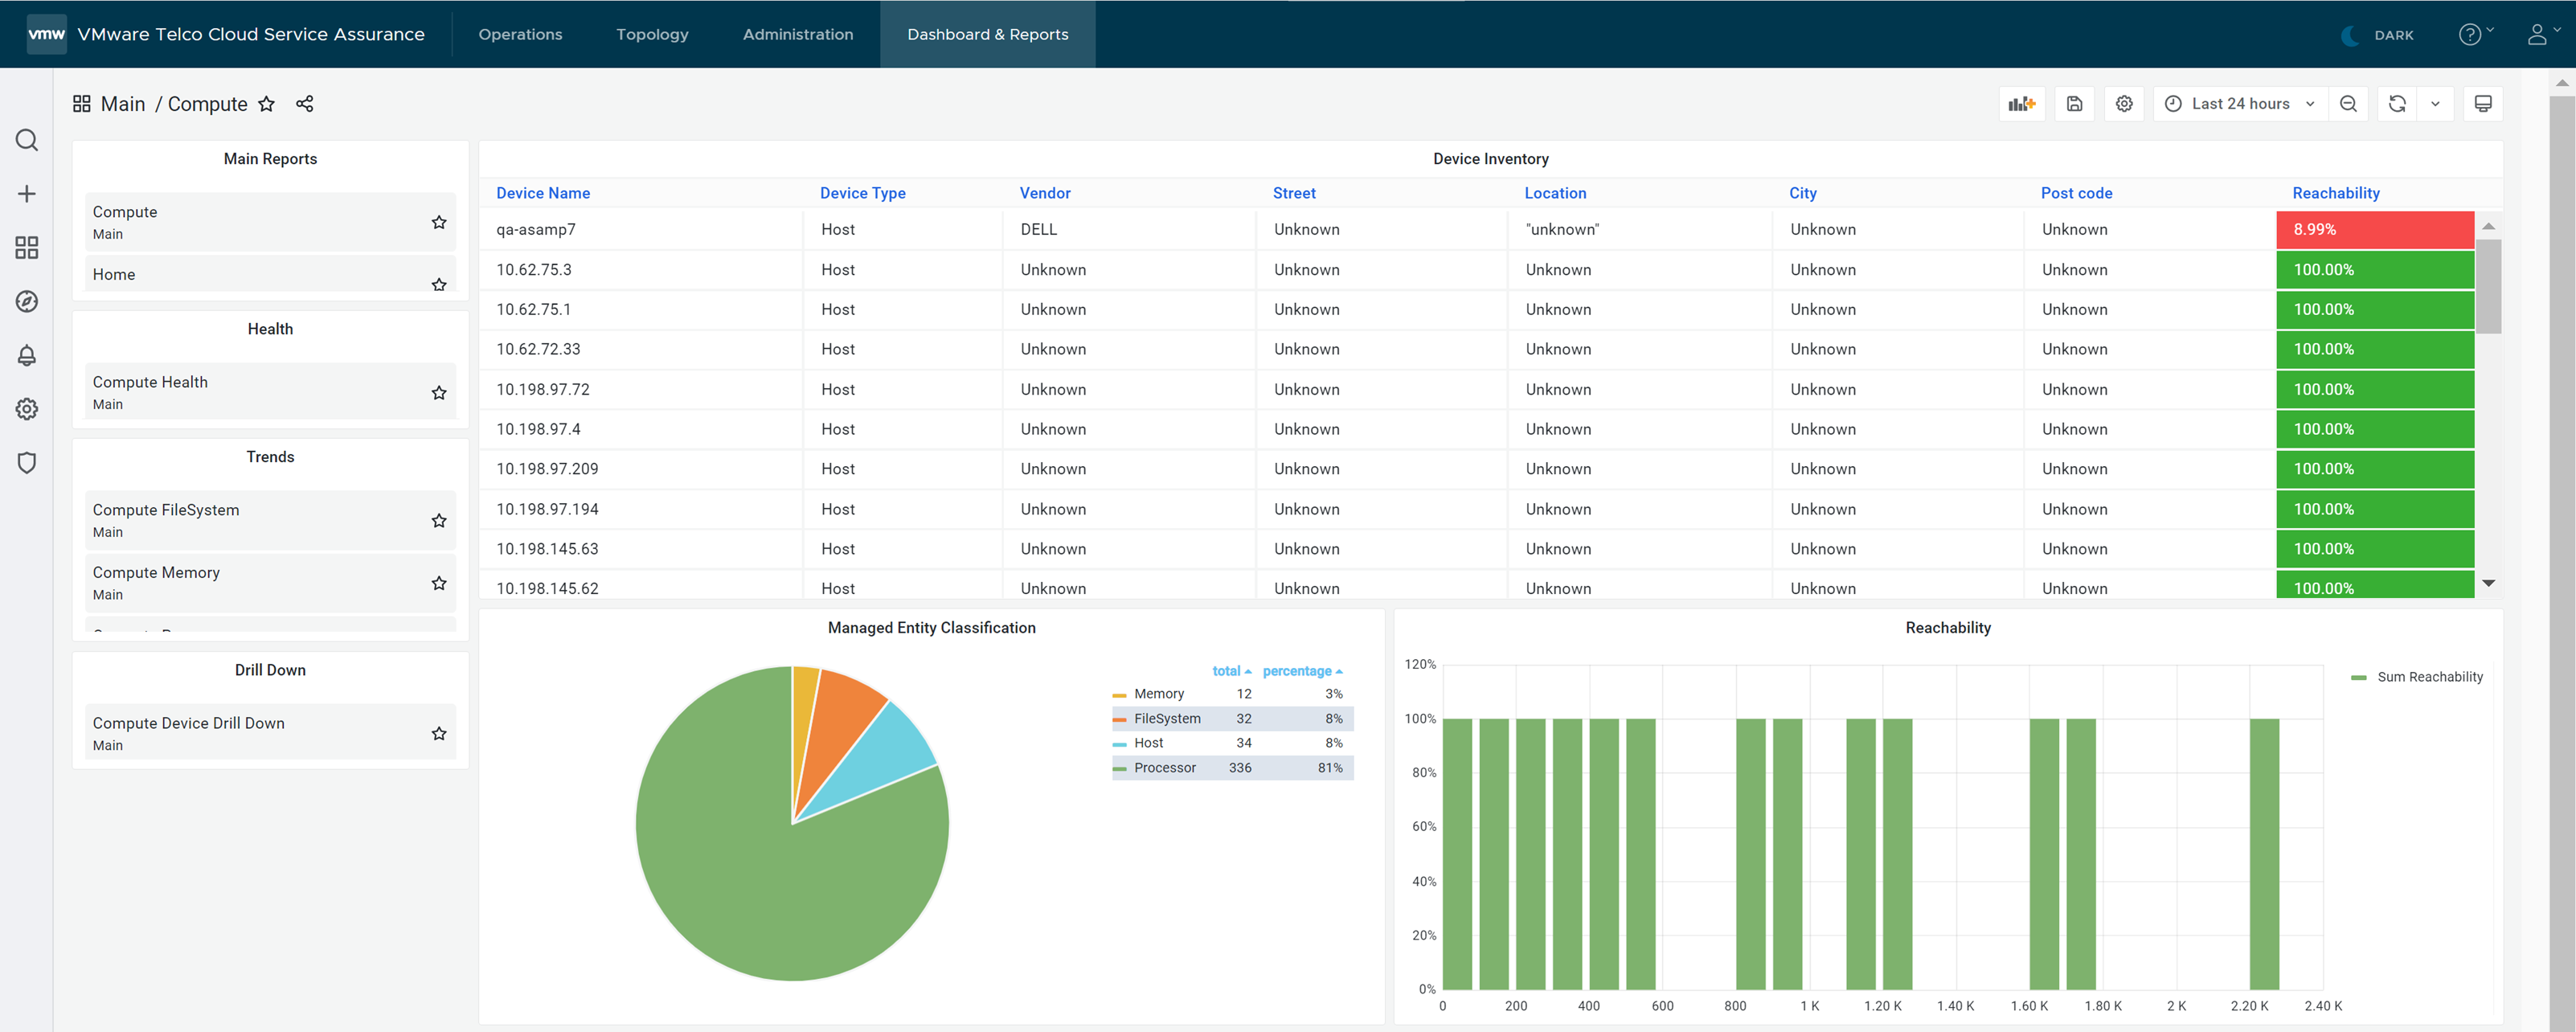
- To view the Compute report, click Compute.
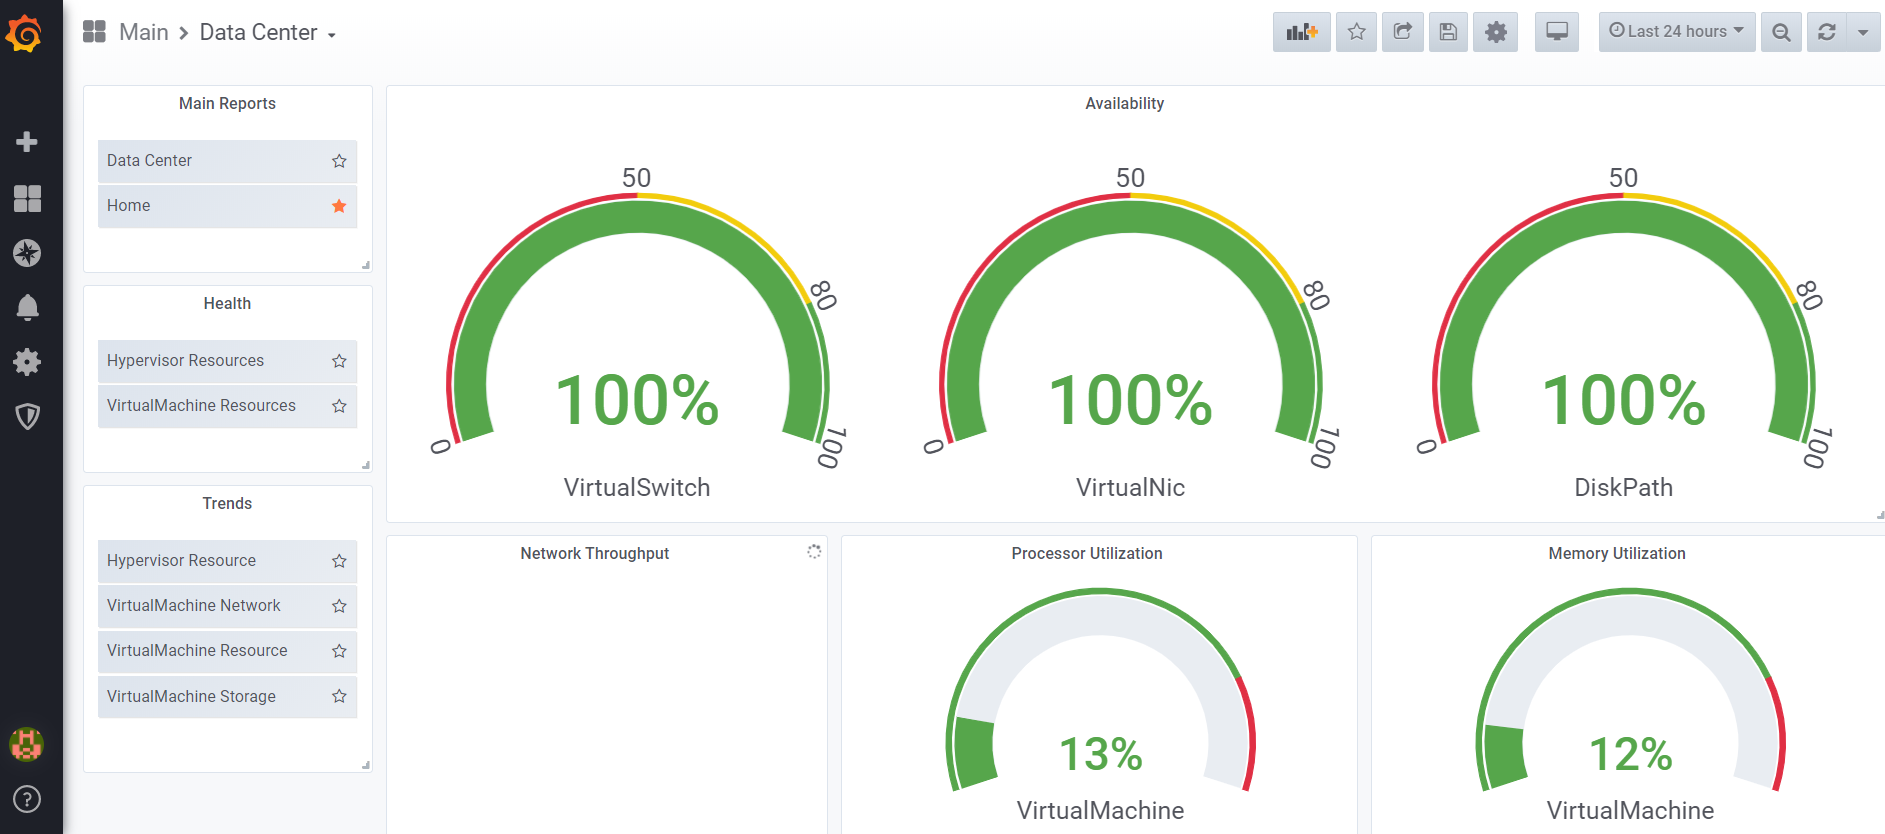
- To view the Data Center report, click Data Center.
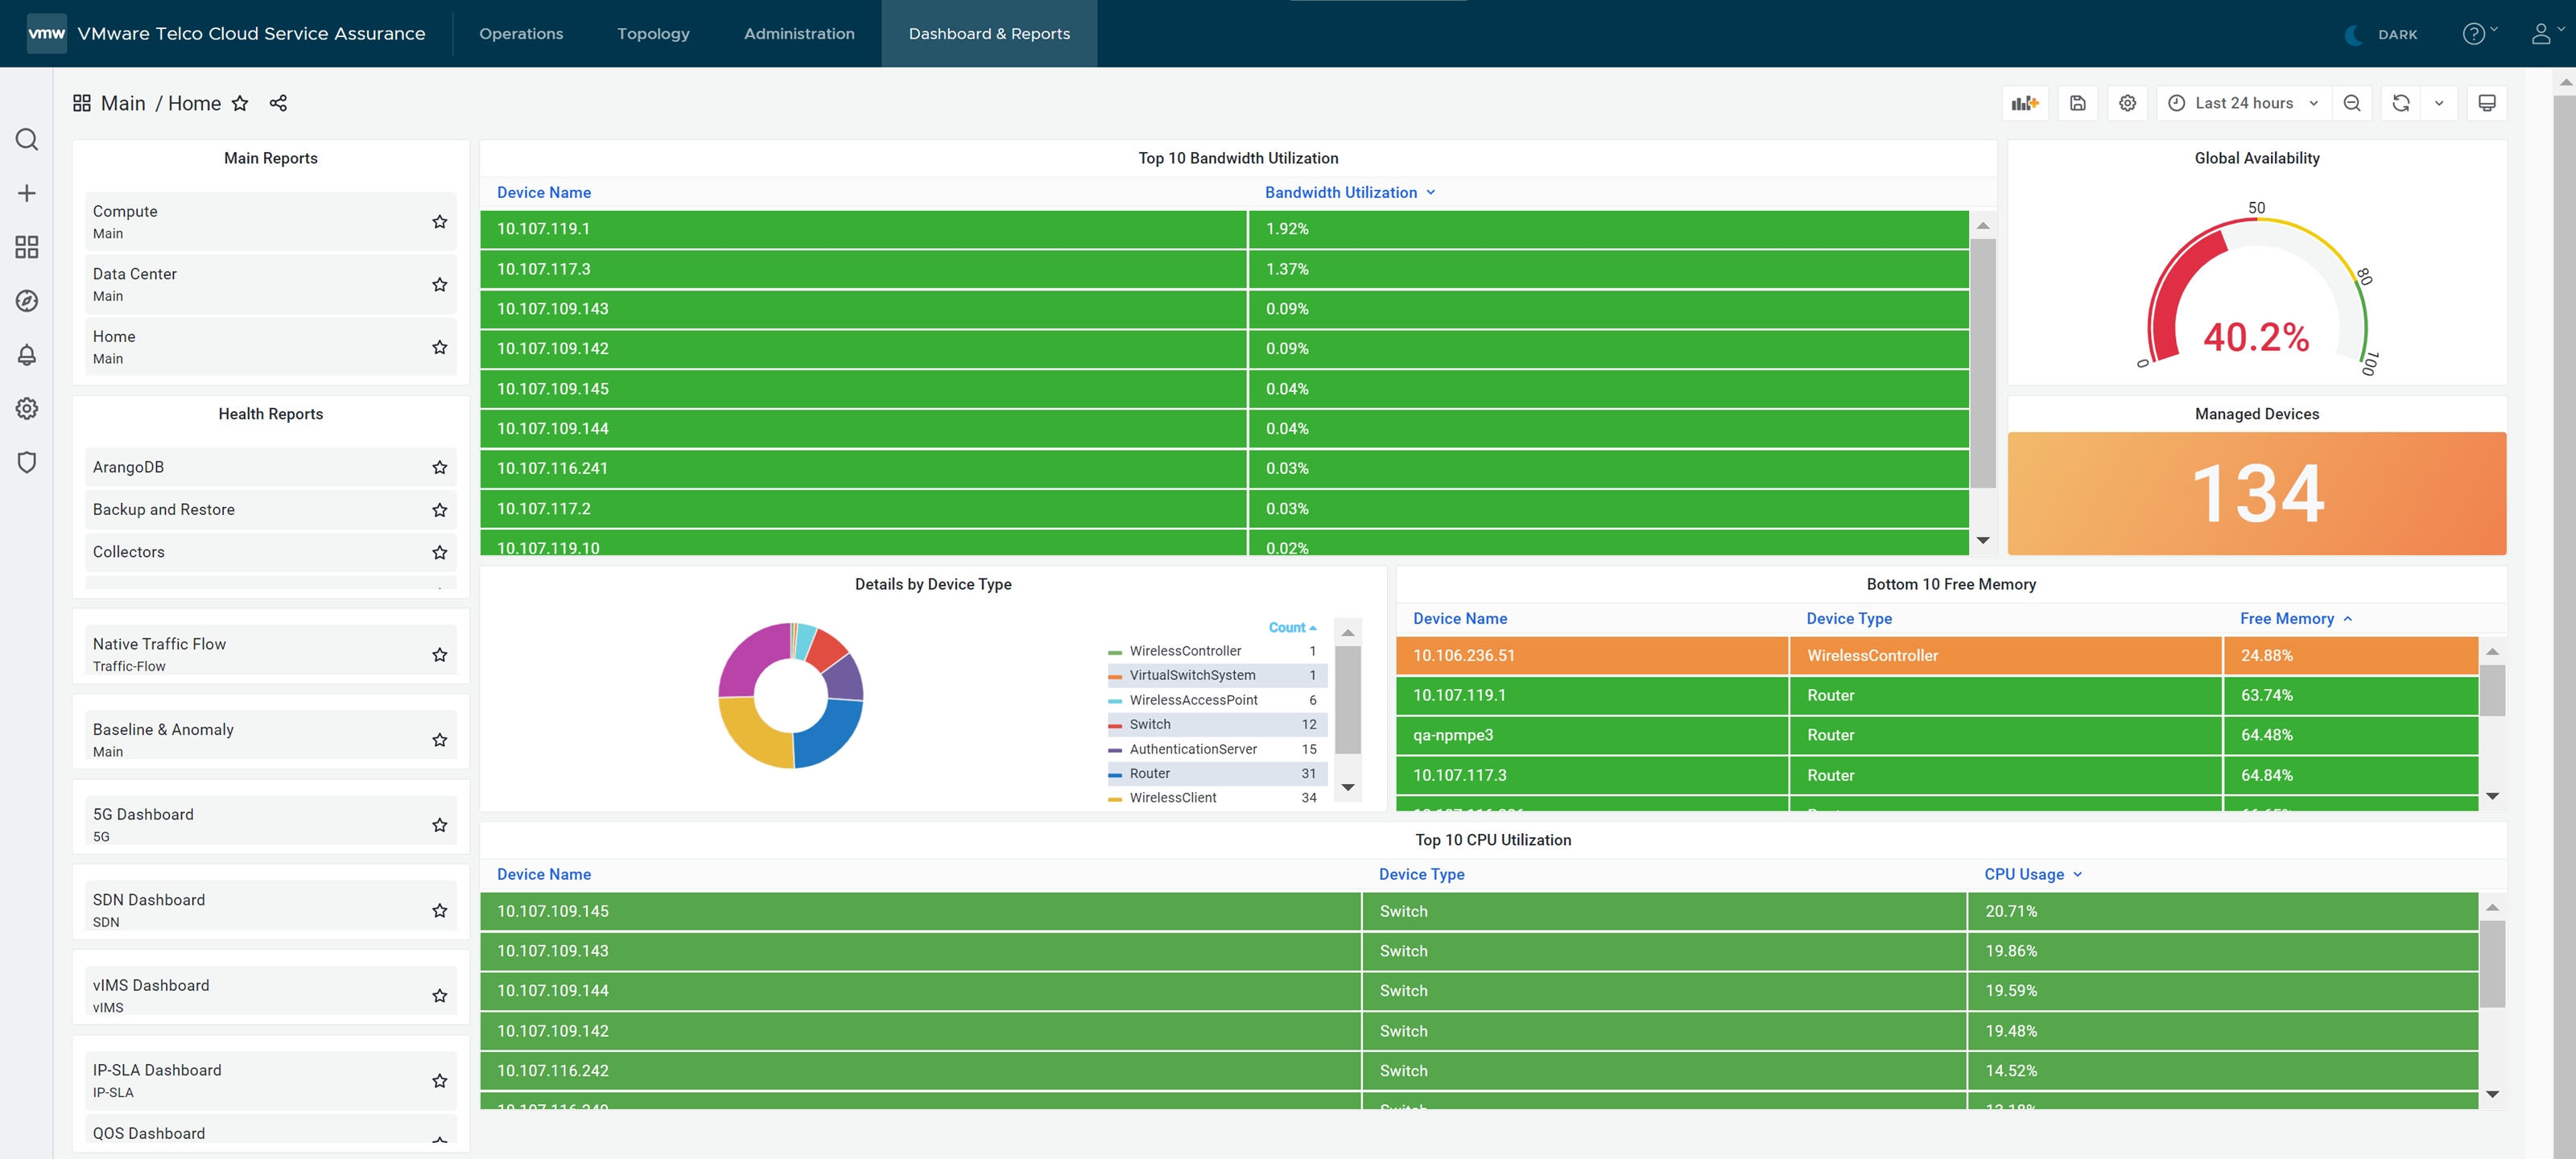
- To view the Home report, click Home.
- To view the Network report, click Network.
- To view the Notifications Summary report, click Notifications Summary.
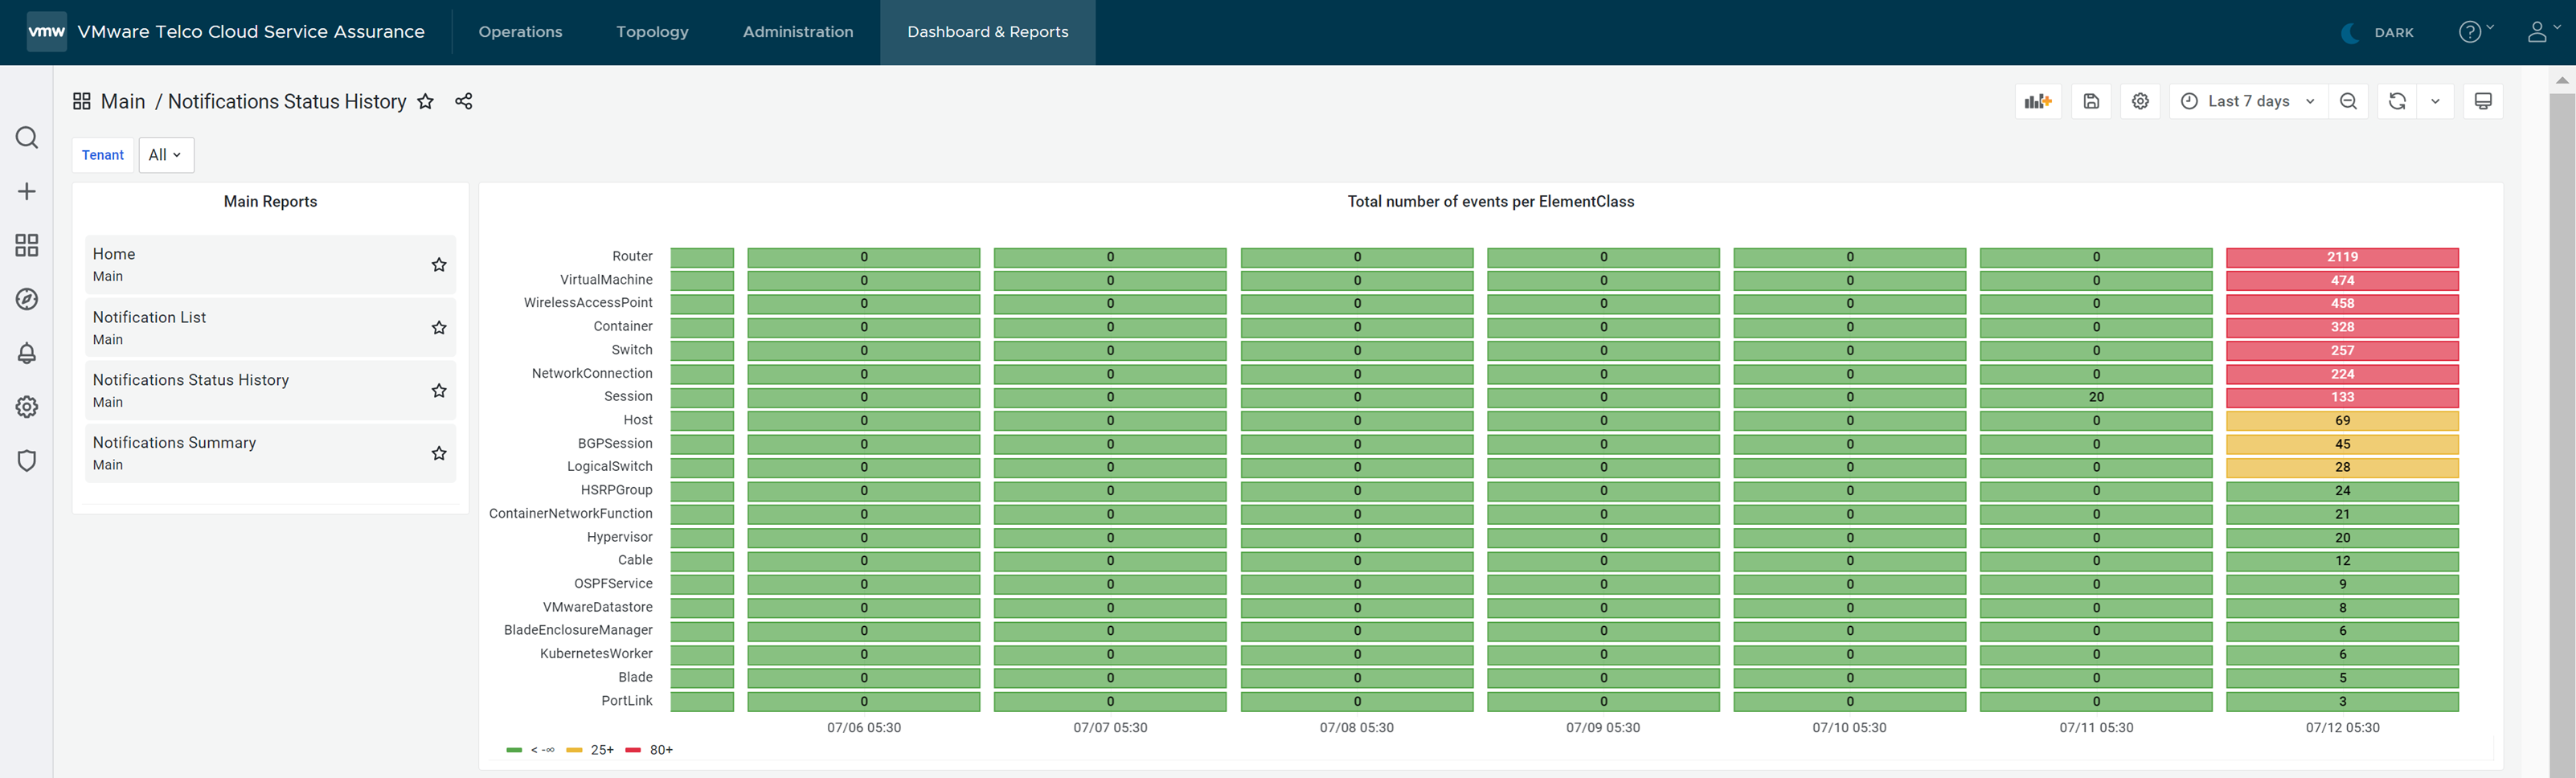
- To view the Notifications Status History, click .