In this topic, you can find information on viewing baseline and anomaly reports.
Prerequisites
To start the data flow, you must start and deploy the VeloCloud collector, see the Collector in VMware Telco Cloud Service Assurance Configuration Guide for more information.
Procedure
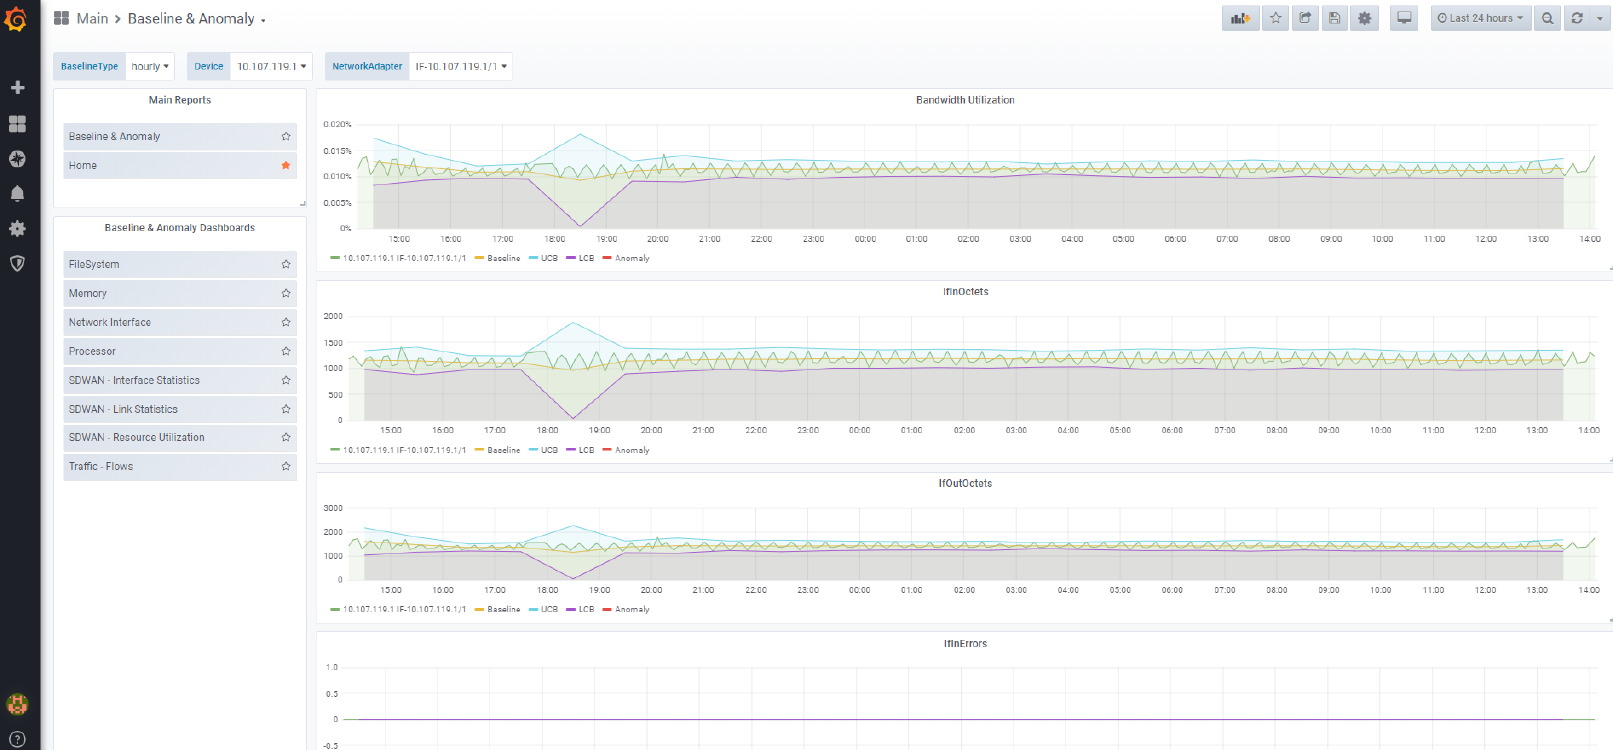
- To view the baseline and anomaly reports, click Baseline & Anomaly.