


This section helps you in creating report in Dashboards and Reports tool.
The privileged users may create a new report either:
- In one of the standard dashboards available.
- In a new dashboard (It requires a new dashboard to be created first).
In order to create a new report in one of the available standard dashboards, follow the procedure:
Procedure
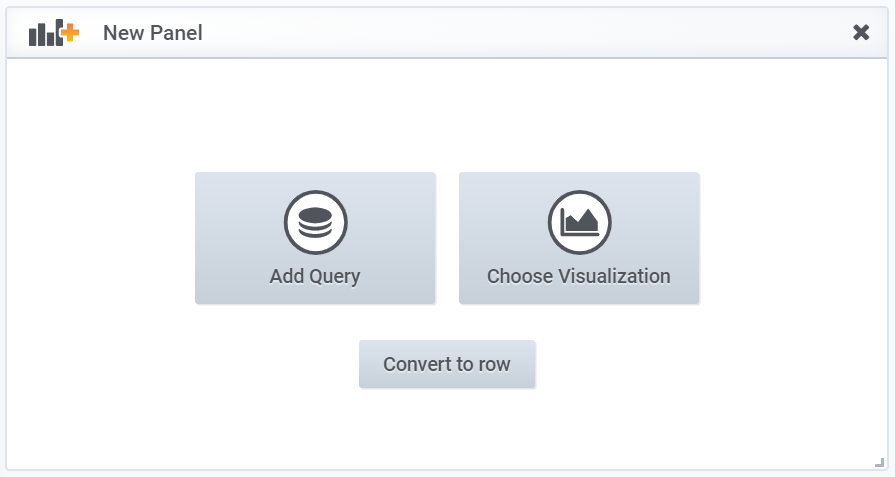
- Click Add a new panel.
Figure 1. Creating Report 
- Select Group by methods and fields as per the requirement.
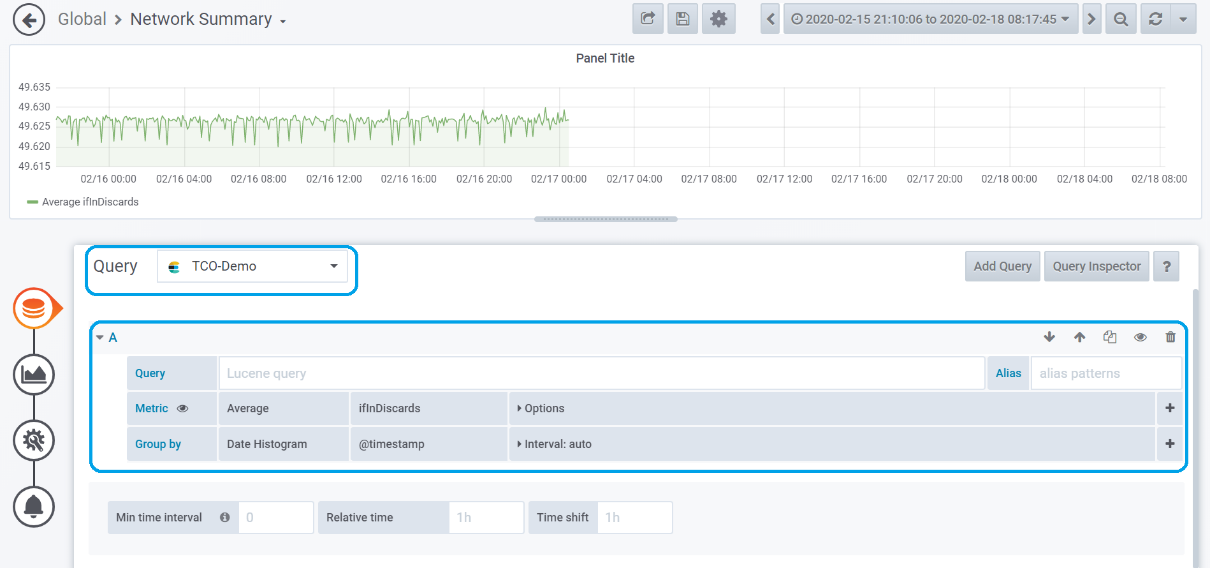 Note: In the above example, report for Average Interface In Packet Discards is being created.
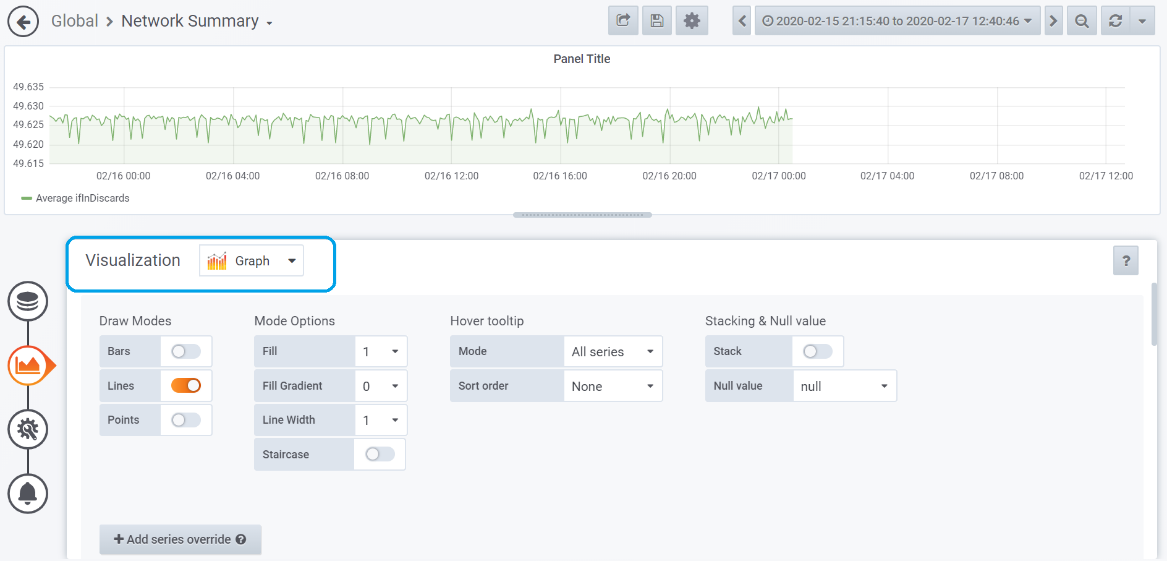
 - In Visualization wizard, select the suitable visualization option, (for example, Graph) as shown below:
- In General wizard, enter appropriate title and description for the report panel.

- Click Save, to put the report in the dashboard.
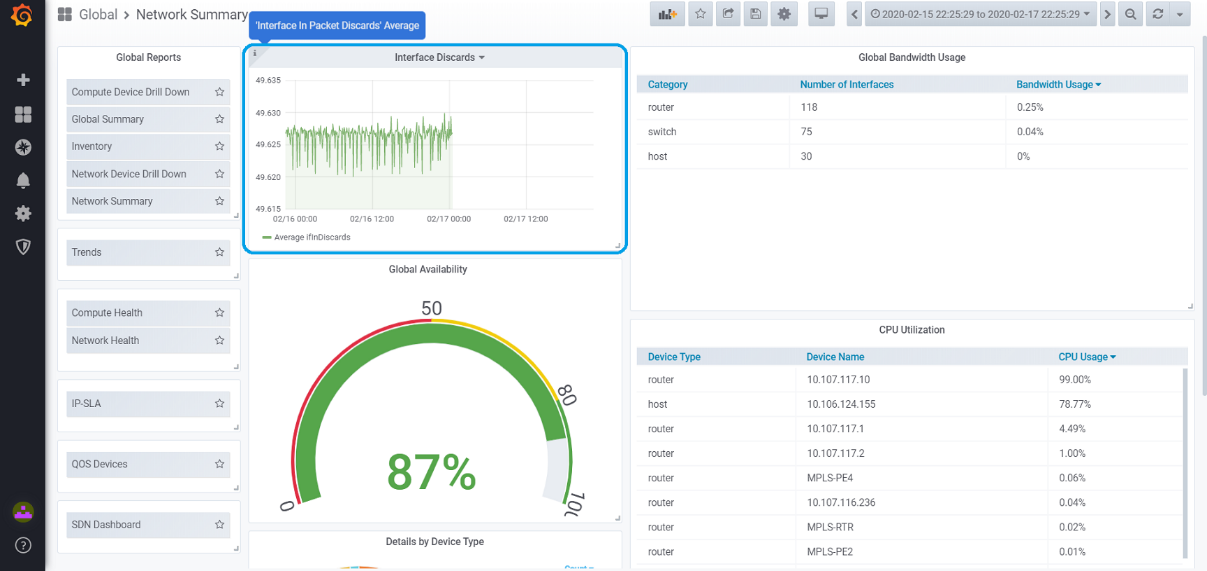 Once the dashboard is saved, launch the dashboard where the new report is created to view the report.
