This section helps you in creating new report in dashboards and report tool.

You may create a new report either:
  • In one of the standard dashboards available.
  • In a new dashboard (It requires a new dashboard to be created first).

In order to create a new report in one of the available standard dashboards, follow the procedure:

Procedure

  1. Navigate to the standard dashboard.
    For example: Main / Home > NCM dashboard.
  2. Click Add panel.
    New Panel window appears.
  3. Click Add new panel.
    A new page with wizards such as Queries, Visualization, General, etc, appears.

    In Query wizard, select Query data source as NCM-PostgreSQL (from drop-down), for the new report.

  4. Click Visualization on right hand pane and select Table.
  5. Select FROM table, SELECT Column, Time Column and WHERE fields as per the requirement. Click + to add more columns.
    Note: Once you keep the pointer on FROM or SELECT, drop down list appears for all the database tables or columns to which database user has access to. There is a limitation in Grafana where only numeric columns are listed under SELECT, as a workaround you can see the available columns from WHERE field.
    Following table lists the important database tables which exist in NCM:
    Table name Description
    cm_auto_discovery_entry Provides the information about the auto discovery job entry details.
    cm_auto_lib_item Provides the automation library item details which are created in the NCM automation library.
    cm_calculate_table_sizes Provides the information about all the NCM table sizes.
    cm_compliance_audit_test Provides the information about the compliance tests which are created in the NCM automation library.
    cm_config_unit_revision Provides the information about the config unit revision for all the devices.
    cm_config_audit_standard Provides the information about the Compliance Standards which are created in the NCM automation library.
    cm_device Provides the information about devices discovered in NCM.
    cm_group Provides the information about Groups created in NCM.
    cm_job Provides the Job related information for the jobs scheduled in NCM.
    cm_network Provides the network related information for the networks created in NCM.
    cm_policy Provides the information on the policies created in the NCM automation library.
    cm_site Provides the site related information which are created in NCM.
    cm_task Provides the task related information for the Jobs scheduled in NCM.
    cm_total_db_size Provides the total database size in MB.
    cm_user Provides the user related information for all the users added in NCM.
    cm_view Provides the views information related to the views created in NCM.
  6. Select Group by field as per the requirement.
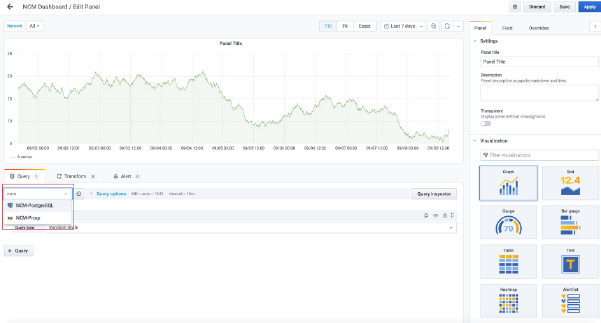
  7. Select Format as Table.
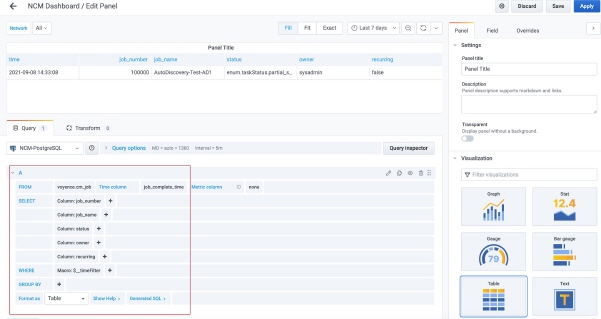
    Note: In the above example, report for job status is being created.
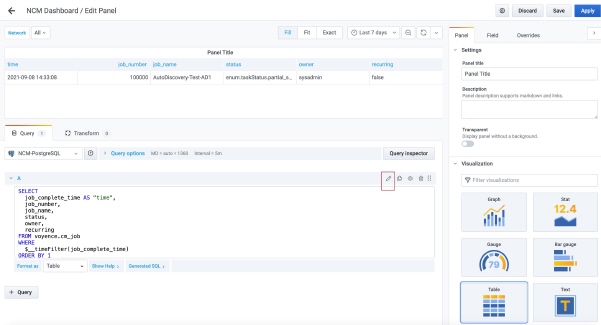
  8. If you have the SQL query ready then instead of adding table and columns separately, you can add the whole query by clicking on the “pencil icon” below Query Inspector.
  9. In Settings in the right pane, enter appropriate panel title and description for the report panel.
  10. To put the report in the dashboard, click Apply > Save Dashboard > Save.
    Once the dashboard is saved, to view the report, launch the dashboard where the new report is created.