In this topic, you can find information on how to monitor and retrieve the health status of the nodes.
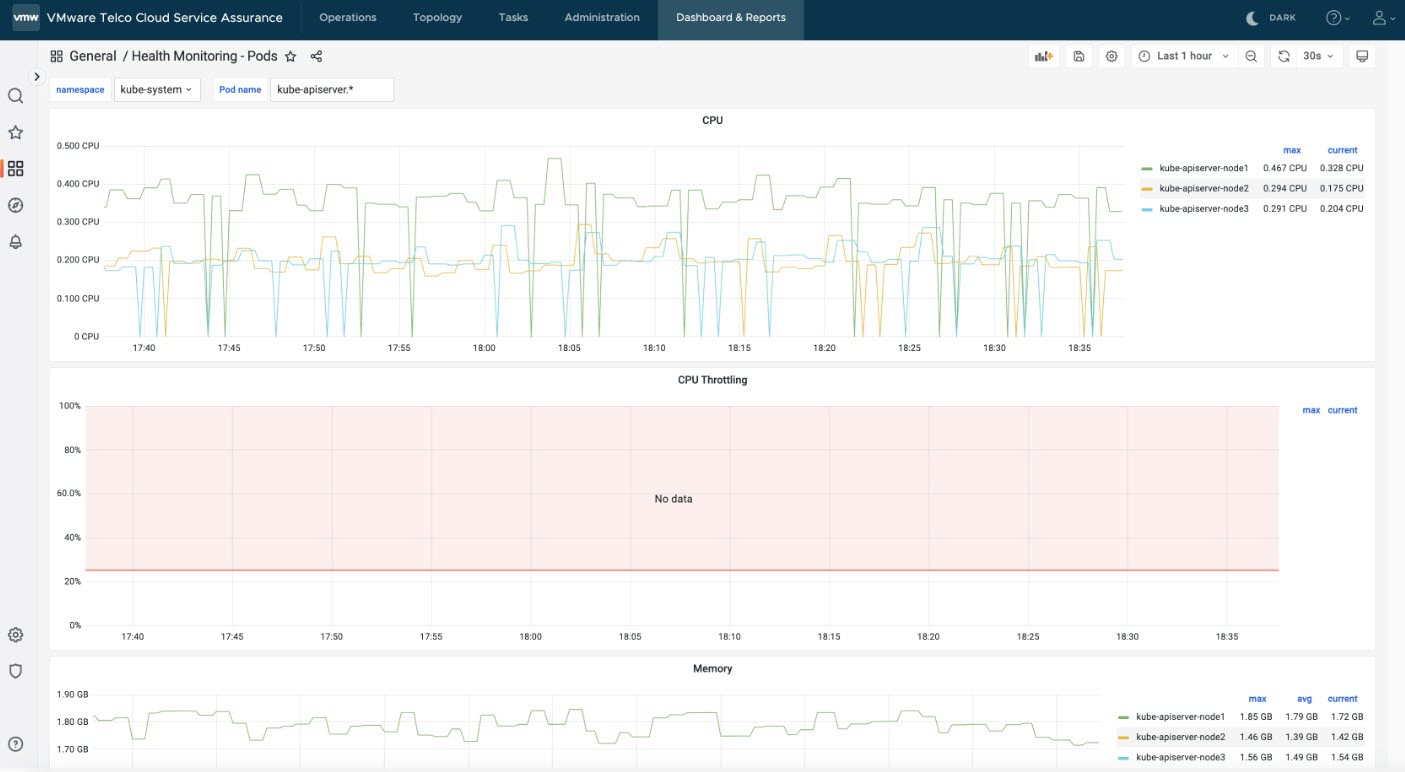
Health Monitoring - Pods
- Go to https://<Telcocloud serviceassurance-ui-IP>..
A typical URL for logging in to the user interface from the same system on which VMware Telco Cloud Service Assurance is installed is, https://10.x.x.x.
- Enter user name and password.
- Click Next.
- Click Dashboard & Reports. The Grafana homepage appears.
- Go to Health Monitoring - Pods dashboard present under the Health Reports section of the Dashboard & Reports Home page.
- To view health monitoring pods for Kube API Server, select
kube-systemfrom the namespace drop-down and filter the pod name usingkube-apiserver.*to get the essential CPU and memory information.
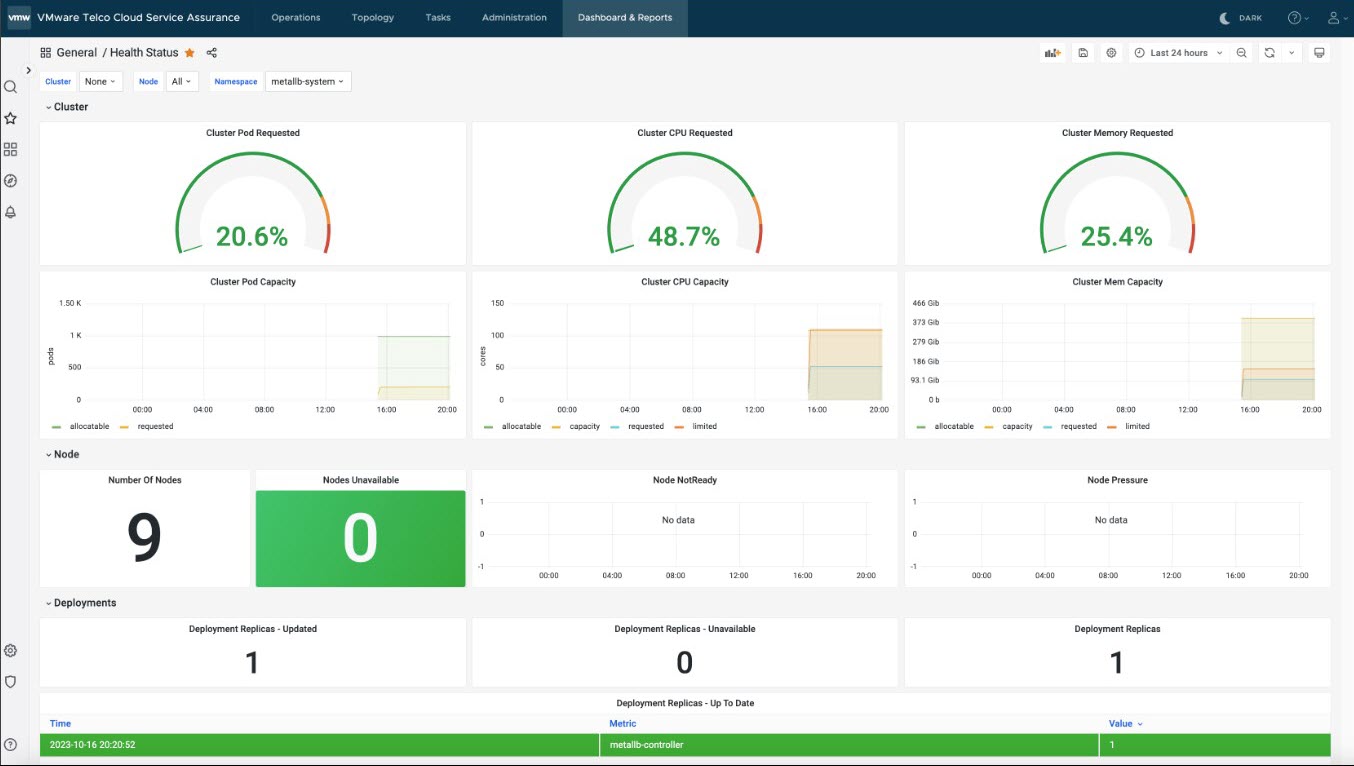
Health Status
In the Health Status dashboard, selecting different namespace gives various details about the node health, metric server health, kafka-dege, vsphere csi health, metallb health, and so on.
- cert-manager
- istio-system
- kafka-edge
- kapp-controller-packaging-global
- kube-node-lease
- kube-public
- kube-system
- metallb-system
- tcx-system
- vmware-system-csi
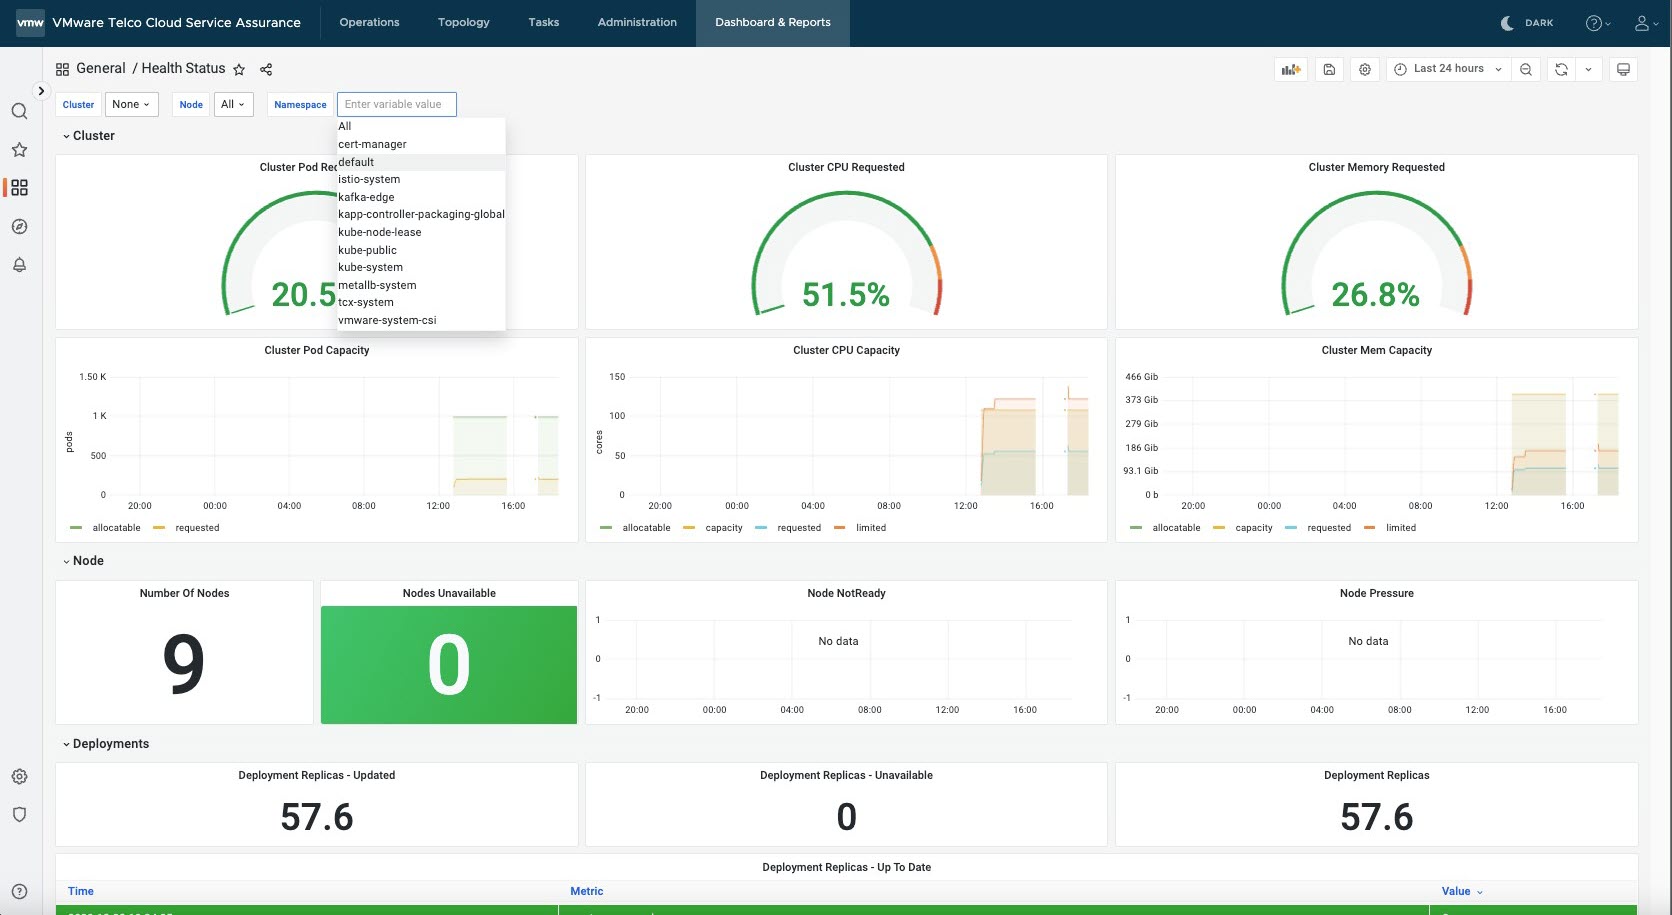
Dashboard represents specific information for the chosen namespace. For instance, upon selecting namespaces such as Default, vmware-system-csi, and metallb-system, the dashboard provides the associated details.
Node Health: By default, this dashboard displays information related to the health status of all nodes.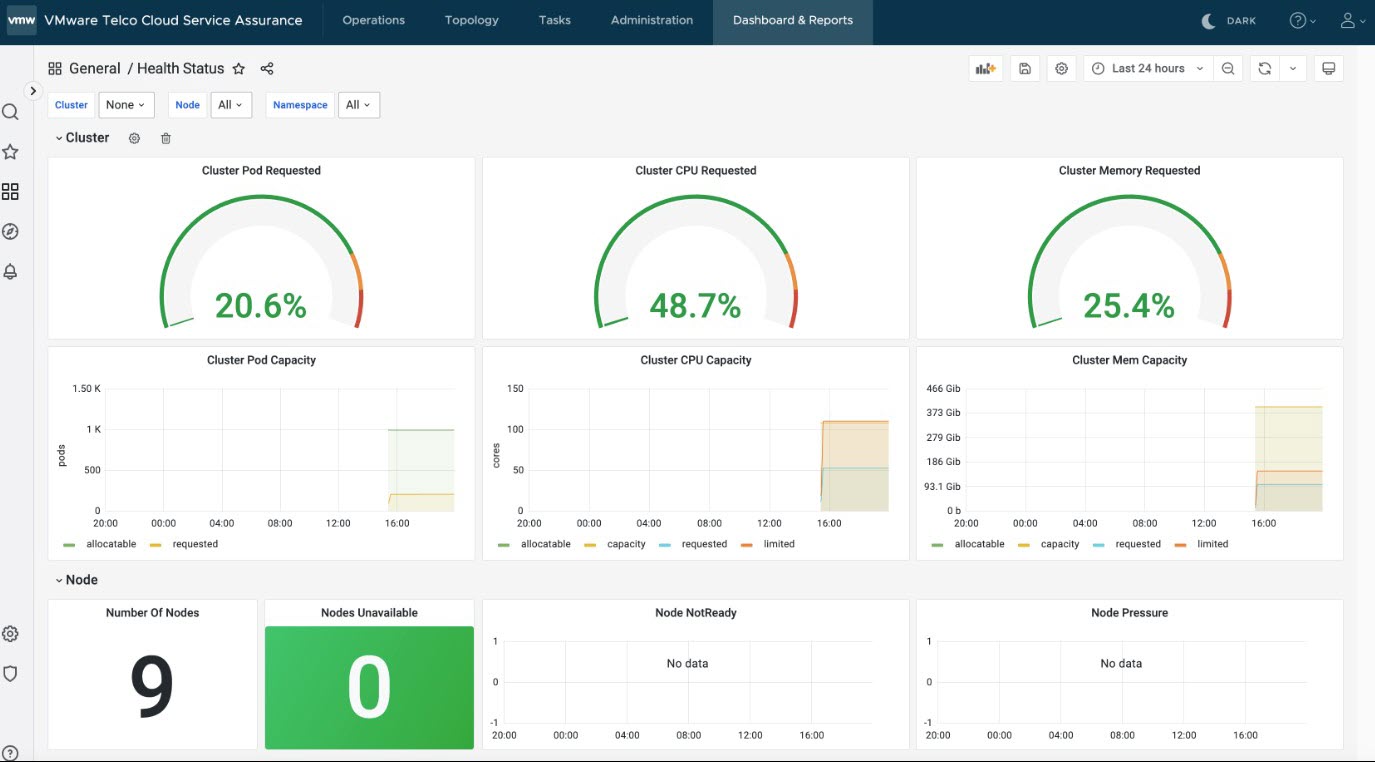
vSphere CSI Health: Choose the vmware-system-csi namespace from the drop-down menu to access detailed information regarding the health status of vSphere CSI.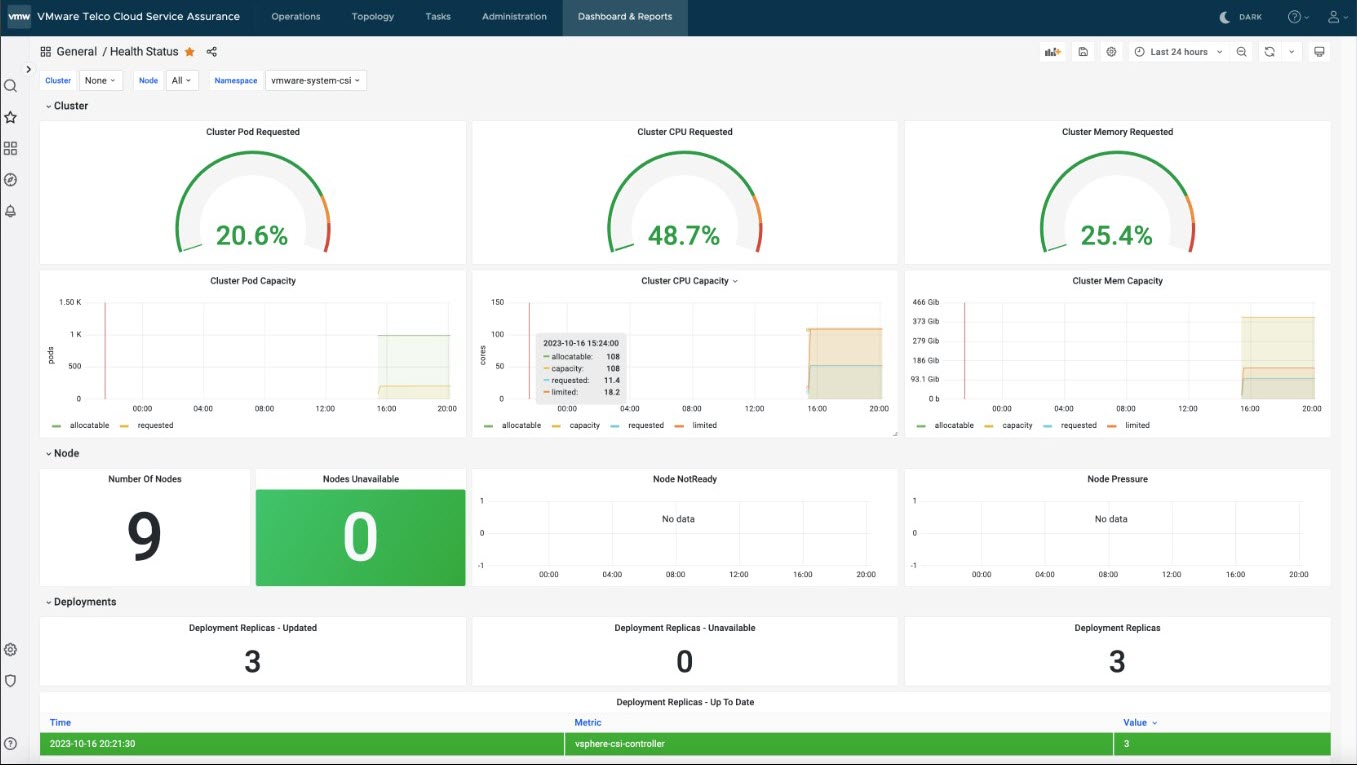
MetalLB Health: Choose the metallb-system namespace from the drop-down menu to access detailed information regarding the health status of MetalLB.