In this section, you can find information on viewing Cisco IP-SLA reports.
Prerequisites
To start the data flow, you must start the Kafka Mapper and Kafka Collector, see the Add Kafka Mapping and Kafka Collector in
VMware Telco Cloud Service Assurance Configuration Guide for more information.
Procedure
- Go to https://<Telcocloud serviceassurance-ui-IP.
A typical URL for logging in to the user interface from the same system on which
VMware Telco Cloud Service Assurance is installed is, https://10.x.x.x.
- Enter username and password.
- Click Next.
- Click Dashboards & Reports.
The
Grafana homepage appears.
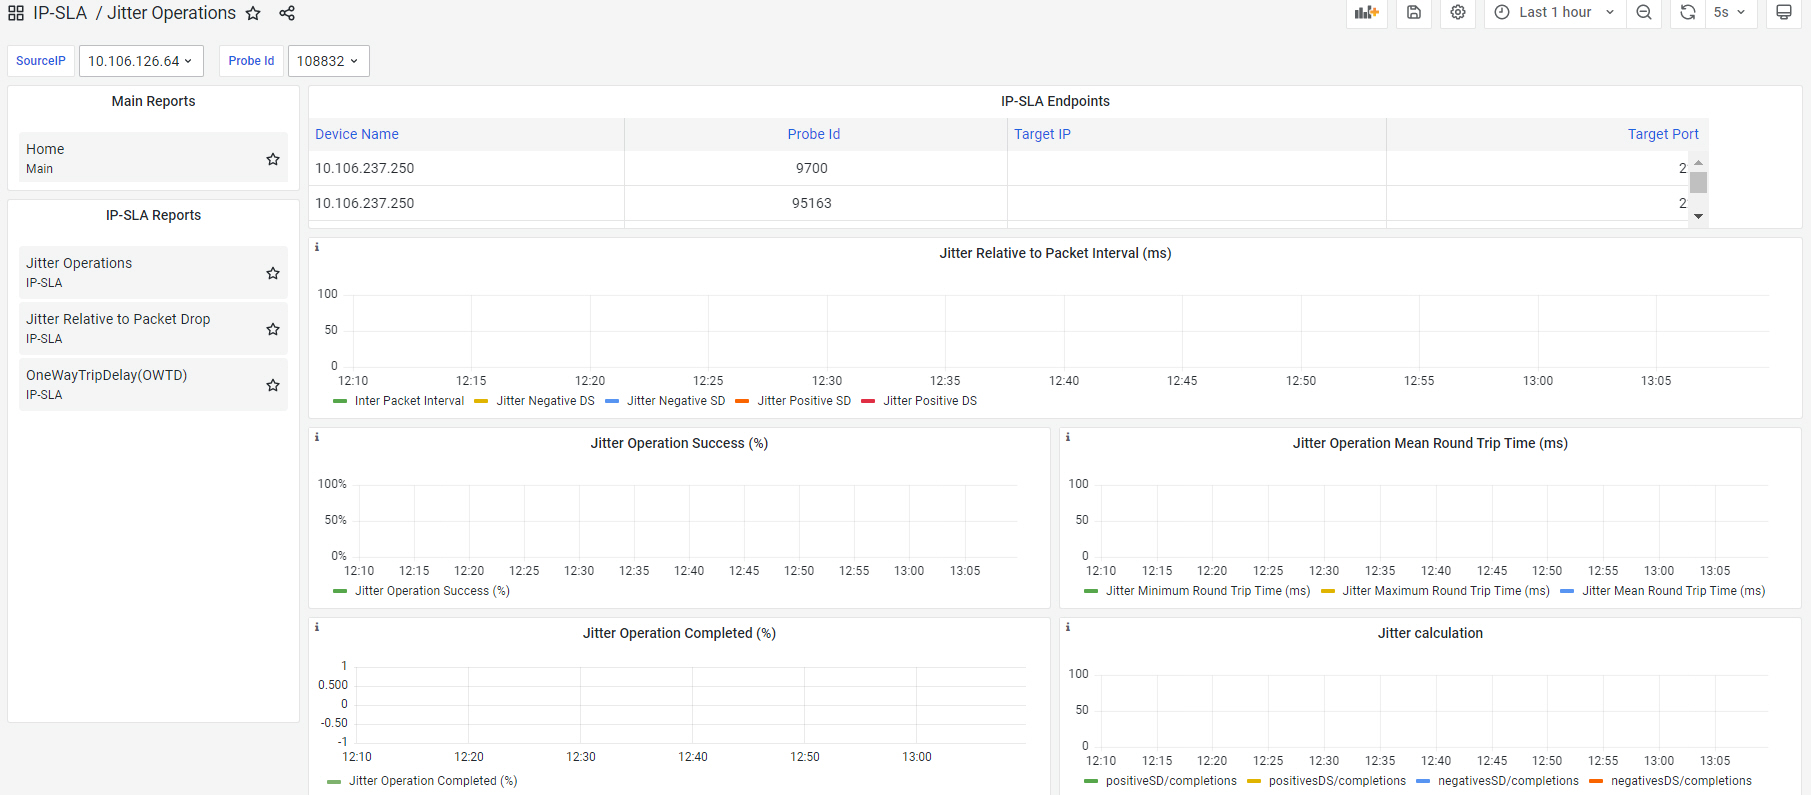
- To view the IP-SLA dashboard reports, click View and click IP-SLA Dashboard.
- To view the Jitter Operations report, click Jitter Operations.
- To view the Jitter Relative to Packet Drop report, click Jitter Relative to Packet Drop.
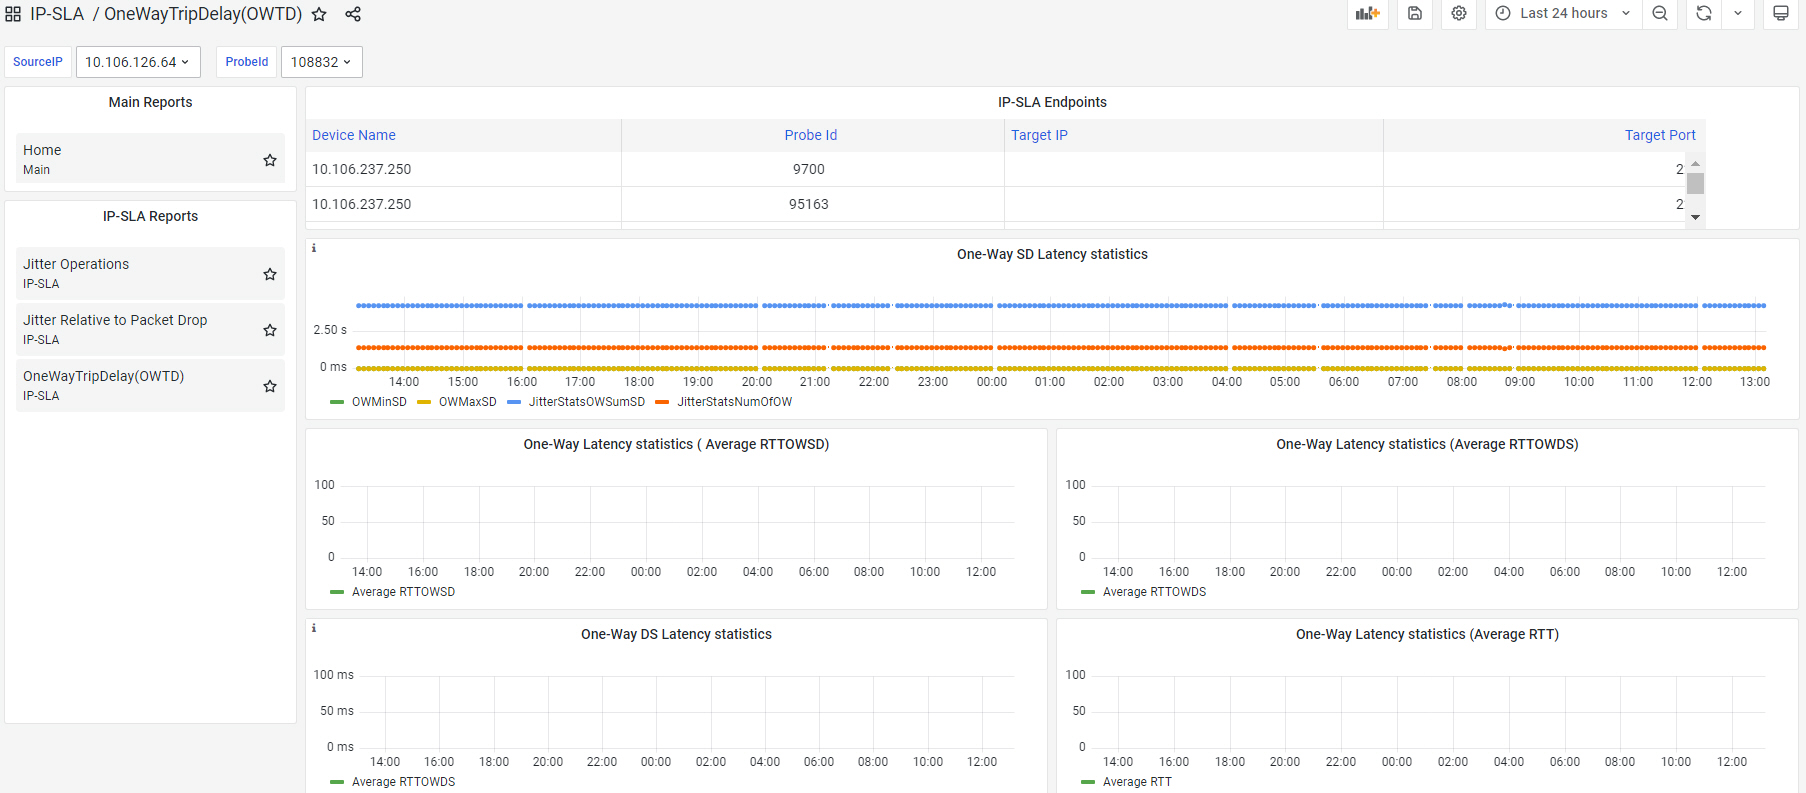
- To view One Way Trip Delay (OWTD) report, click OneWayTripDelay(OWTD).