


The traffic map shows the graph of an instance, if the instance supports physical connectivity as one of it's map type, and represents the traffic utilization and Input Packet Error as performance metrics (unit is in percentage) on an edge which connects two interfaces.
To access traffic maps, navigate to Topology > Topology map > Traffic map and then select Traffic map in the drop-down in the right pane.
Maps are available only for the instances which are having 'Physical connectivity', as one of available types for the selected instance.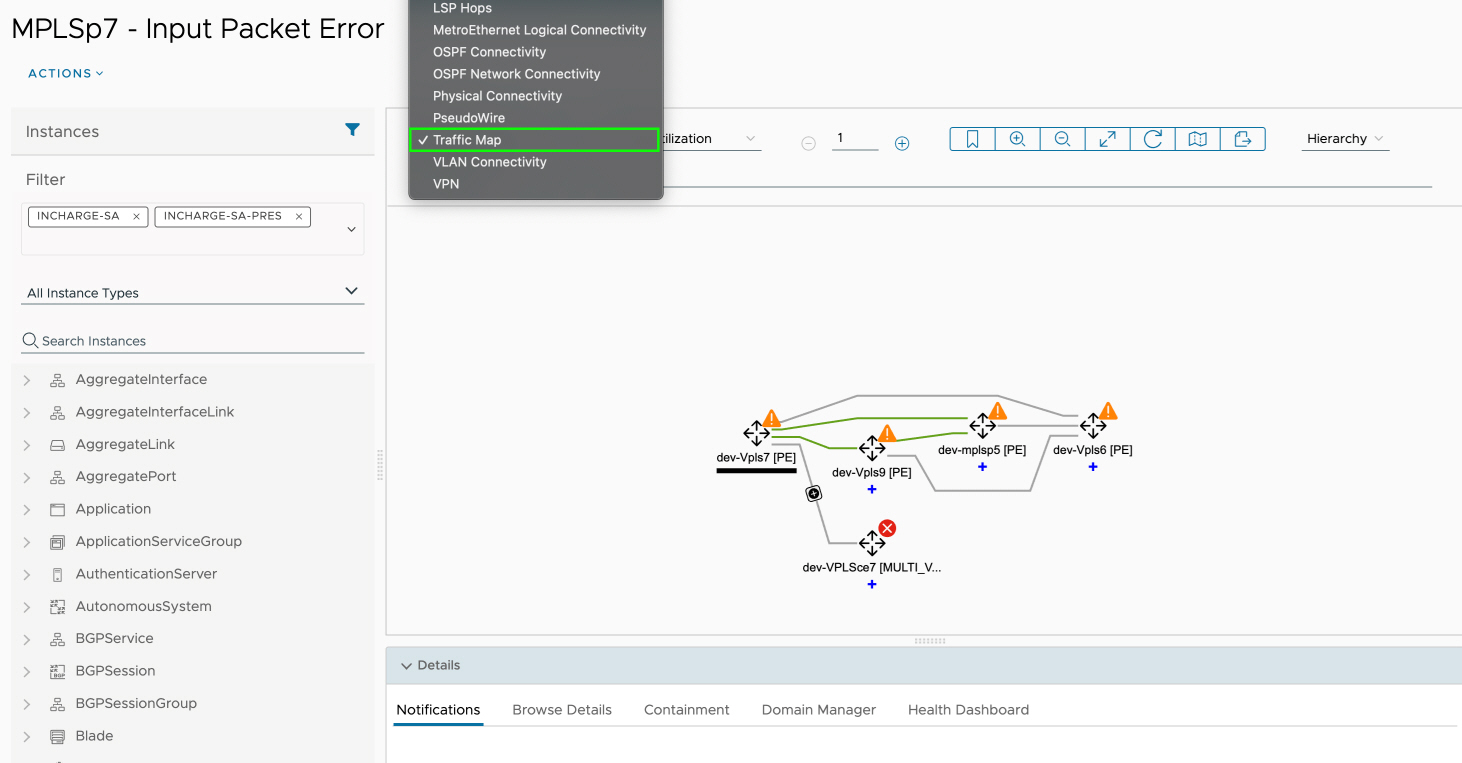
After selecting the Traffic Map in the drop-down in the right pane, you can choose between Traffic Utilization and Input Packet Error from another drop-down. Default selection is Traffic Utilization, unless and until a view is saved with another selection.
To show the color legend for the traffic map graph edges, in the graph toolbar you can click Traffic-legend button. The edges are color coded based on their performance metric range.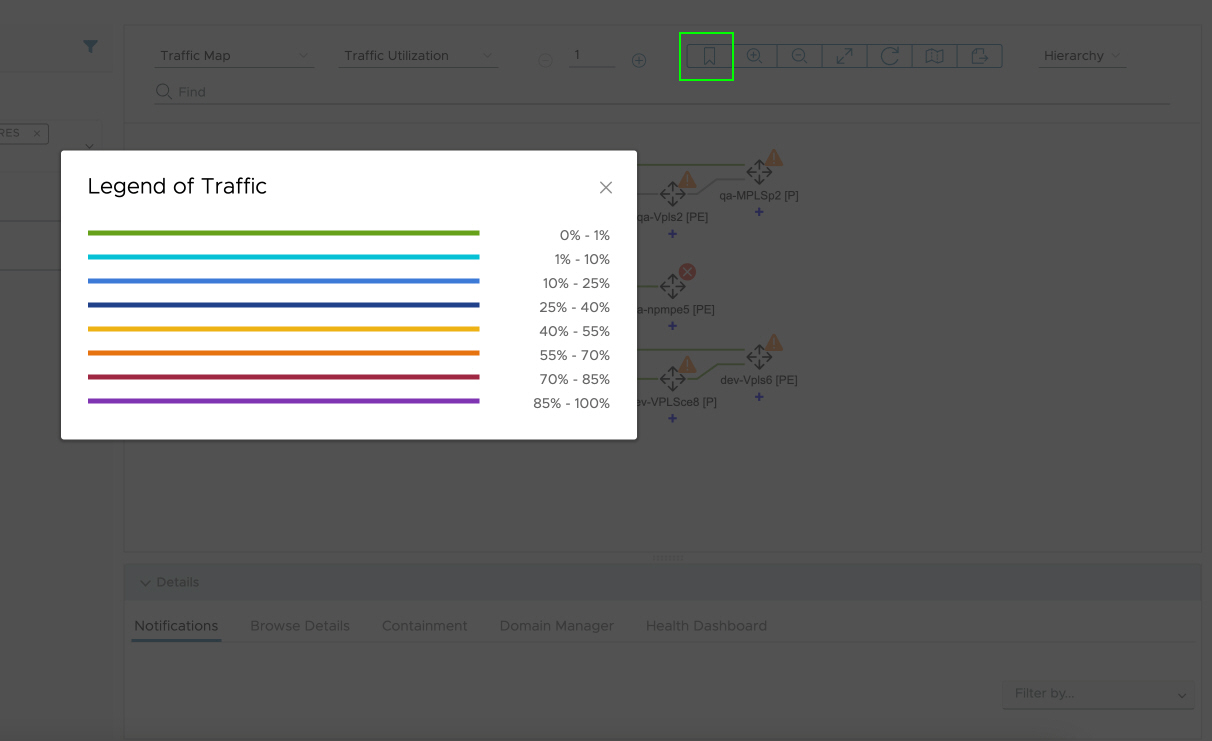
After the traffic map is loads, the graph edges are colored according to the legend mentioned above. The edges are bi-colored and shows the performance metrics of the ‘from interface’ and ‘to interface’.
You can view the performance metrics by hovering over the edges. A popup appears with the required performance metrics.
In case of aggregate edges, click the aggregate edge to view the performance metric for each individual edge.
The green squared blocks are color coded according to the color legend mentioned above and displays the interface metric on hovering over it. The tooltip displays the interface name along with the performance metric.
In case an edge has no metric data, the popup displays No metric found instead of metric values.
