


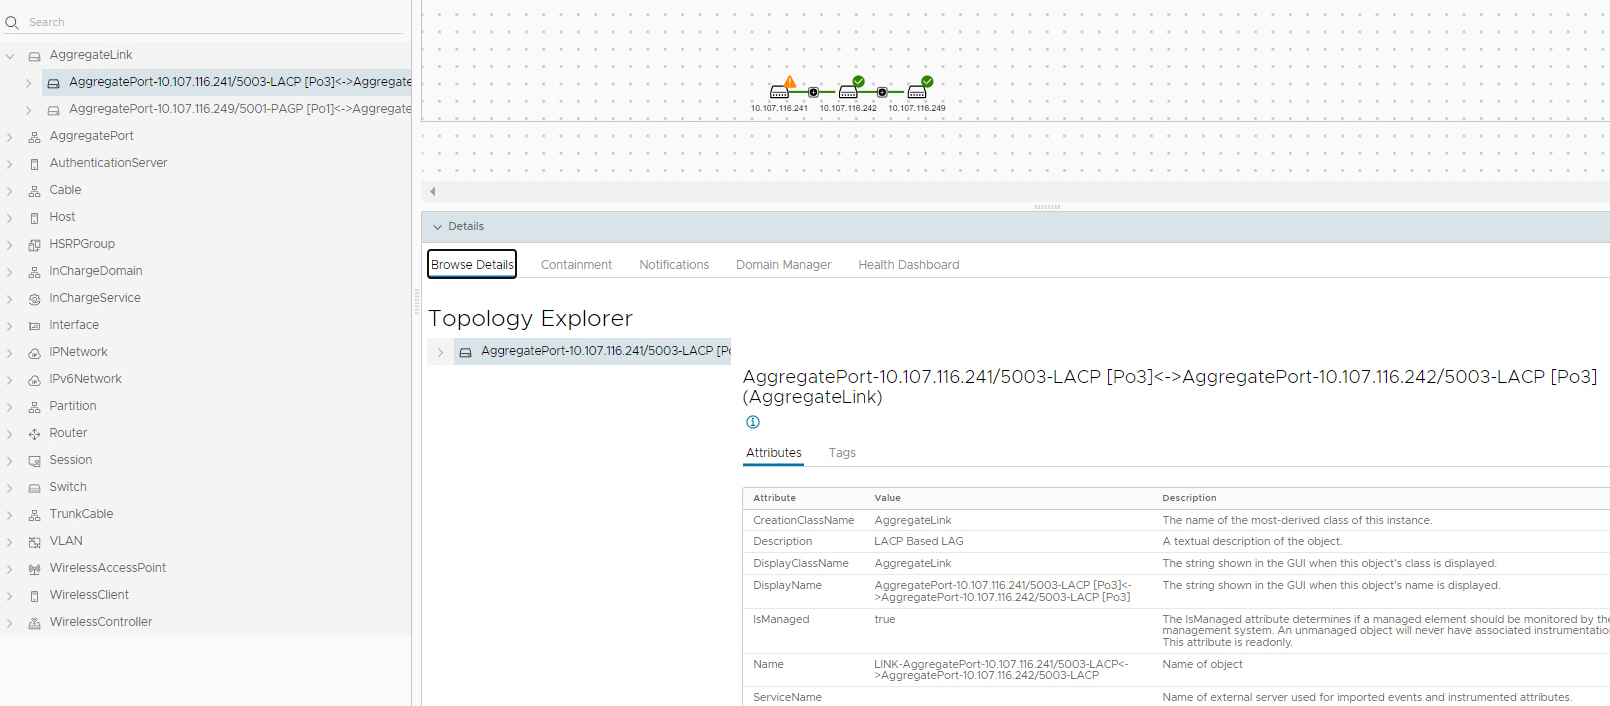
You can view various details for classes and instances from the topology map.
Details
The Details tab displays the attribute's information and also the enriched tag information.
Containment
The Containment displays the information about a managed element in a tabular format. Containment information varies depending upon the type of the element and the type of analysis performed by the underlying domain.
As examples, for a network connection, the containment information includes details about connection points. For a device managed by IP Performance Manager, containment information includes details about the device’s memory.
The Containment dialog box is available for selected notifications in the Notification Log Console, for selected instances in the Topology Browser Console, and also for selected nodes in the Map Console. When multiple Domain Managers manages an element, the Containment dialog box includes all the containment information for each domain.
Notifications
The Notifications provides information on a set of notifications, defined by the user profile associated with the user. The notification information can include, for example, the type of event, the element that is affected, and the severity of the event.
Domain Manager
In a topology map, the Domain Manager provides list of the domain managers. Select a domain manager and click Get Details button, it fetches the data from underlying Domain Manager.
