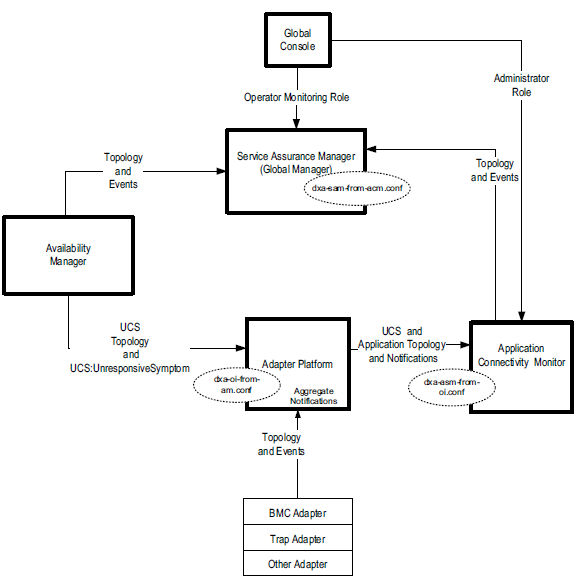
Application Connectivity Monitor receives information from several sources: events from software element checks, and topology/events from the Adapter Platform. The Application Connectivity Monitor Domain Manager correlates this information and sends the root cause and impact analysis as well as topological information to the Global Manager.
Figure ACM architecture and process flow on illustrates the architecture and process flow of ACM after it is deployed.

Starting from the bottom left corner, the process flow and the roles of components are as follows:
- The Performance Manager sends topology and event information to the Adapter Platform and the Global Manager.
The Performance Manager performs an initial discovery of topological objects to monitor performance.
The Performance Manager sends events about performance to the Adapter Platform. Specifically, the Performance Manager sends the Unitary Computer System (UCS) event, ResourceExceptionSymptom, which indicates that the computer system is experiencing CPU/memory degradation.
The Performance Manager sends events about performance, including device- and performance-centric analysis of root causes, in IP networks to the Global Manager. - The Availability Manager sends topology and event information to the Adapter Platform and the Global Manager.
The Availability Manager performs an initial discovery of computer systems such as hosts, load balancers, and firewalls.
The Availability Manager sends events about connectivity to the Adapter Platform. Specifically, the Availability Manager sends the Unitary Computer System (UCS) event, UnresponsiveSymptom, when a computer system is not responding.
The Availability Manager sends events about connectivity, including analysis of root causes, in IP networks to the Global Manager. - Adapters provide a method for integrating event information from third-party monitoring applications. The adapters send their processed information to the Adapter Platform. The use of adapters is optional. An SNMP Trap Adapter translates incoming SNMP traps into notifications and sends the notifications to the Adapter Platform.
- The Adapter Platform receives topology and events from underlying Domain Managers and adapters. It normalizes and consolidates the events and generates notifications, including aggregates.
The Adapter Platform sends Unitary Computer System (UCS) topology and notifications pertaining to systems, software services, and application task checks to the Application Connectivity Monitor Domain Manager.
The Adapter Platform sends all topology and notifications to the Global Manager. - Application Connectivity Monitor discovers and monitors applications. It also receives topology and notifications from the Adapter Platform. The Application Connectivity Monitor Domain Manager correlates this information and sends the root cause and impact analysis as well as topological information to the Global Manager.
- The Global Manager serves as the central point for monitoring and managing your entire technology infrastructure by obtaining data from multiple distributed domains. The Global Manager consolidates the information from underlying sources and sends notifications to its client applications, Global Consoles, or adapters.
- The Global Console is the graphical interface for all Ionix products. The console enables operators to monitor the state of the managed environment and quickly respond to notifications. Administrators with appropriate privileges and access control use the console to discover topology, administer underlying domains, as well as administer users, user profiles, program tools, and escalation policies. The Global Console is typically installed on many hosts.