Viewing notifications displayed in the Global Console is a common method of obtaining the results of Application Connectivity Monitor’s analysis. This section briefly describes how to access the information included with a notification.
About notifications
Application Connectivity Monitor reports the results of its analysis to Service Assurance Manager. The Service Assurance Manager combines the analysis from Application Connectivity Monitor with the analysis from other managed domains and displays this information to users in the Global Console.
When Smarts diagnoses a problem or detects an abnormal condition, it generates a notification. The Global Console displays notifications in several ways:
- In the tabular format of a Notification Log view.
- In the color state of icons on a map.
“Application Elements and Their Faults” contains information about the topology elements monitored by Application Connectivity Monitor and the problems diagnosed.
Viewing the properties of a notification
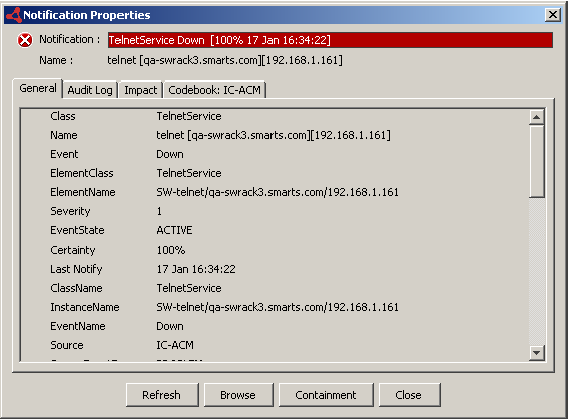
The Notification Properties dialog box provides detailed information about individual notifications.
To display the Notification Properties dialog box:
- Access the Notification Log view.
- Double-click a notification.
The Notification Properties dialog box appears as illustrated in Figure Notifications Properties dialog box

The Notification Properties dialog box displays one or more of the following tabs:
- General — Lists the properties of the notification. Notifications, similar to topology elements, are objects in the repository of the Global Manager. As such, their properties are codified as attributes. A notification’s attributes identify the managed element where the problem occurred, the severity of the problem, and the underlying domain, or source, that diagnosed the problem.
- Audit Log — Lists any actions performed on the notification by the system or by a user. Actions can include:
- Acknowledging
- Taking ownership
- Invoking a tool
- Impact — Lists managed elements, if any, that are affected by the notification.
- Codebook — Lists the symptomatic events used to diagnose a root-cause problem. A separate Codebook tab is displayed for each underlying domain that diagnoses the problem as a root cause.
- Details — Lists information about the notification from the underlying domain that sent the notification. Information may include attributes of the affected element or threshold values and their related attributes.
- Caused By — Lists the problems or events that are causing the selected notification. This is the inverse of the Codebook tab.
- Aggregates — Lists the component events of a notification.
The Service Assurance Manager Operator’s Guide contains additional information about the Notification Properties dialog box.