This section describes the procedure to create an alarm.
Prerequisites
Procedure
- Go to https://Telcocloud serviceassurance-ui-IP.
A typical URL for logging in to the user interface from the same system on which VMware Telco Cloud Service Assurance is installed is, https://10.x.x.x.
- Enter the username and password.
- Click Next.
- Navigate to Administration > Alarms Management > Alarming.
- Click Add.
- Under Description, update the following parameters:
- Name: Provide the name for an alarm. Only letters, numbers, and hyphens are allowed.
- Description: Provide the description for an alarm. This field is optional.
- Alarm Status: Select the status of an alarm. The supported values are listed in the selection drop-down menu. By default, the alarm status is Disabled.
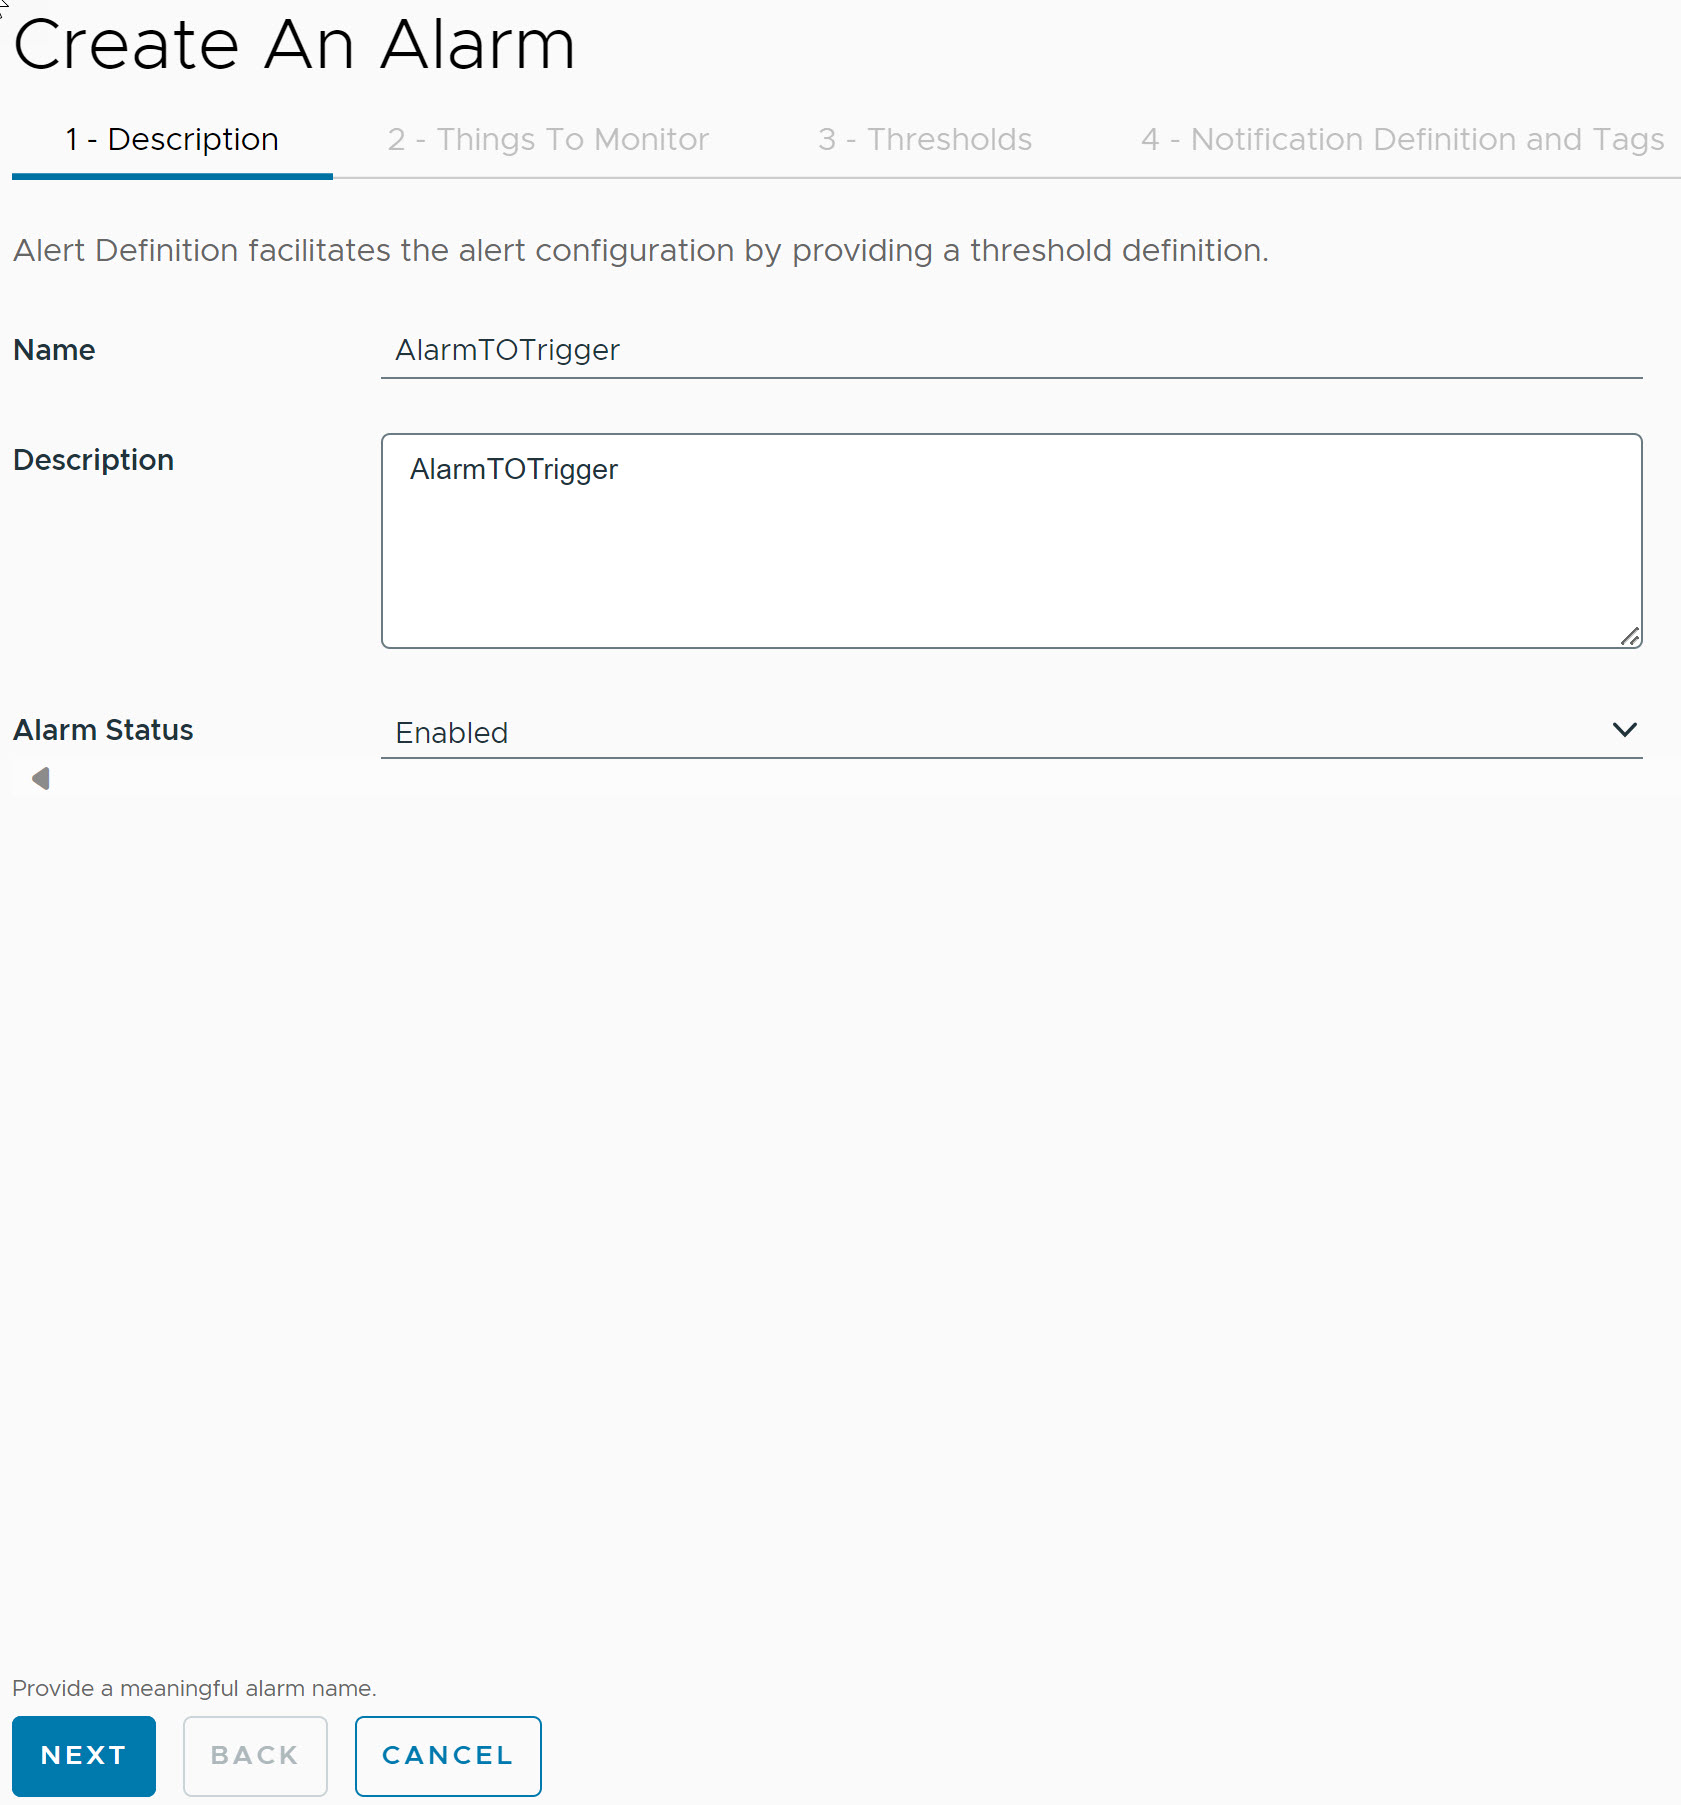
- Click Next.
- Under Things to Monitor, select the entity type from the Entity Type drop-down menu.
Note:
- It is mandatory to select the Entity Type.
- The fields such as Property, Expression, and Value appears after you select the entity type. It is optional to select values for these fileds.
- The display of the Filters may take upto 60 seconds based on the available devices and metrics.
If you opt to select values for Property, Expression, and Value, then perform the following steps:
- To add multiple properties for a given metric within the same group, click Add Condition. The AND condition tag is used to filter metrics within the same group.
Note:
- The property drop-down list contains capital letter objects followed by small letter objects.
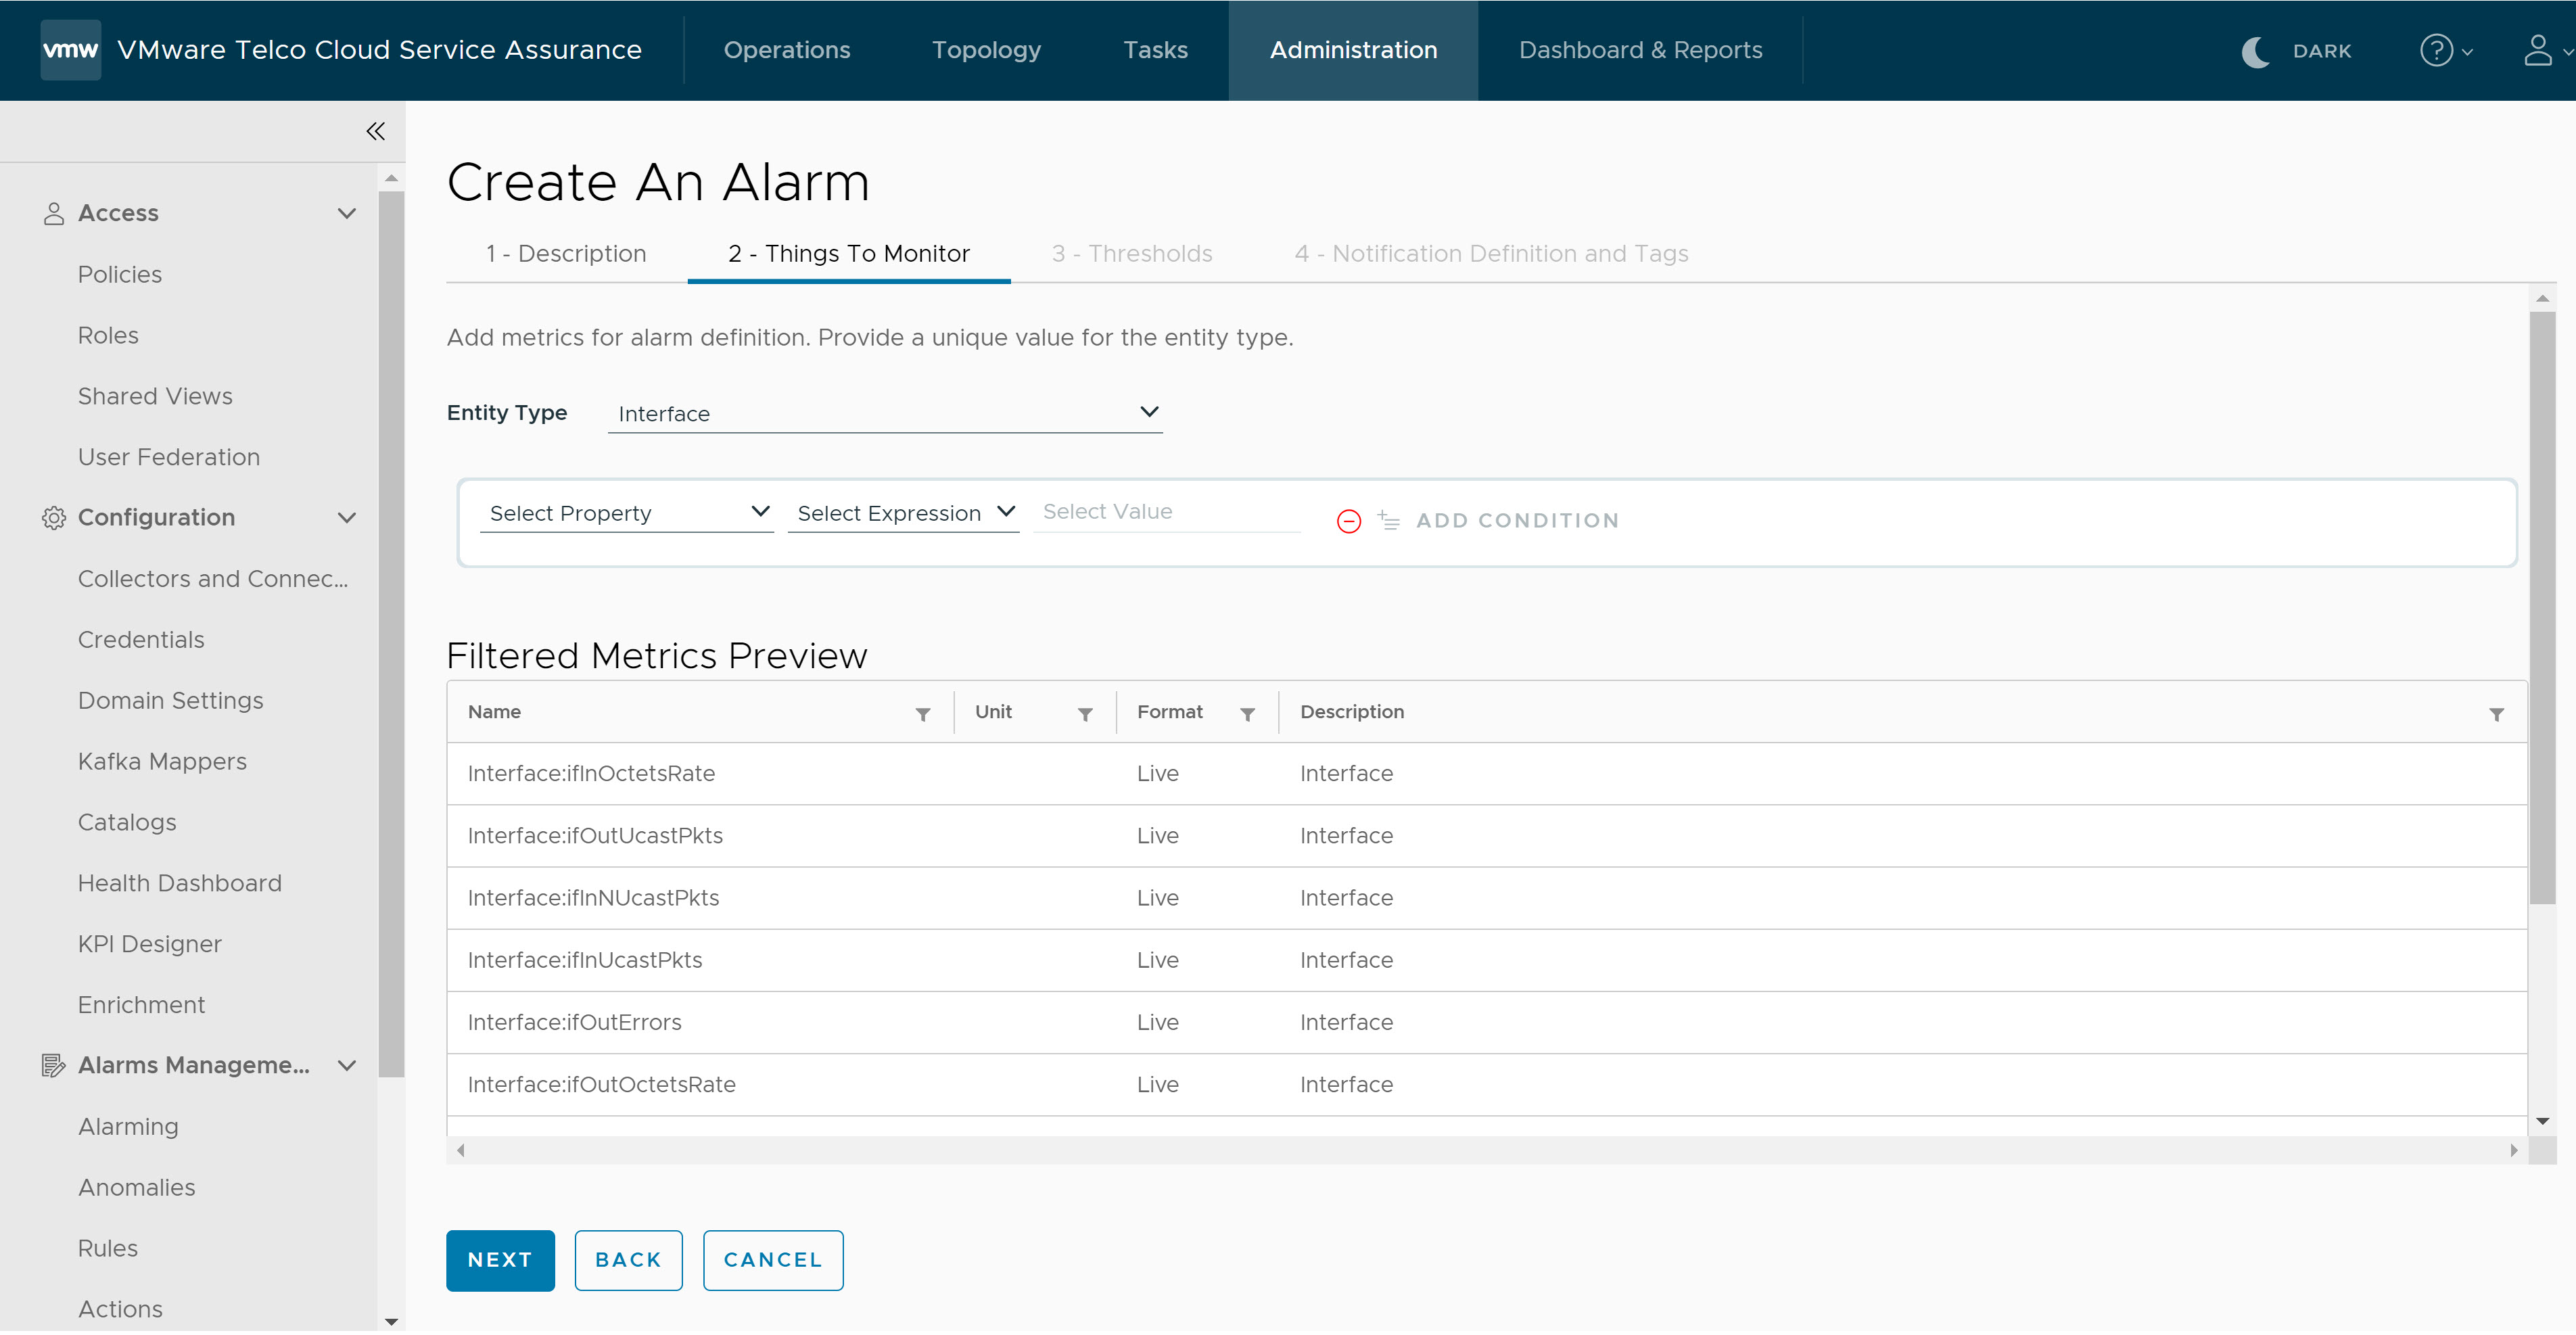
You can view the applicable metrics in the metrics preview grid.
Note: The filtered metrics preview grid does not display values for Units and Descriptions, as the source metrics do not have them. The Format column displays whether the metric is a live or static metric. - Click Next.
- Under Thresholds, perform the following tasks:
- Select the Alarm Condition as Any Condition or All Conditions.
- Select Metric Threshold for which alarms to be created, with Severity from dropdown.
- Select Threshold Condition from dropdown.
- Provide the range of values according to Duration.
- Select Time Unit from dropdown.
- To add multiple severity conditions for multiple threshold values, click Add Condition Button.
- To add multiple metrics, click Add Metric and fill the values for all the fields as given from steps a to f under step 10.
- From the Select An Option drop-down menu, select And or Or to include both the metrics or any one metric.
Note: You can add any number of metrics you want and select the option to include them.
- To clear alarm under certain threshold limits, click Add Clear Condition and fill the values for all the fields as given from steps a to f under step 10.
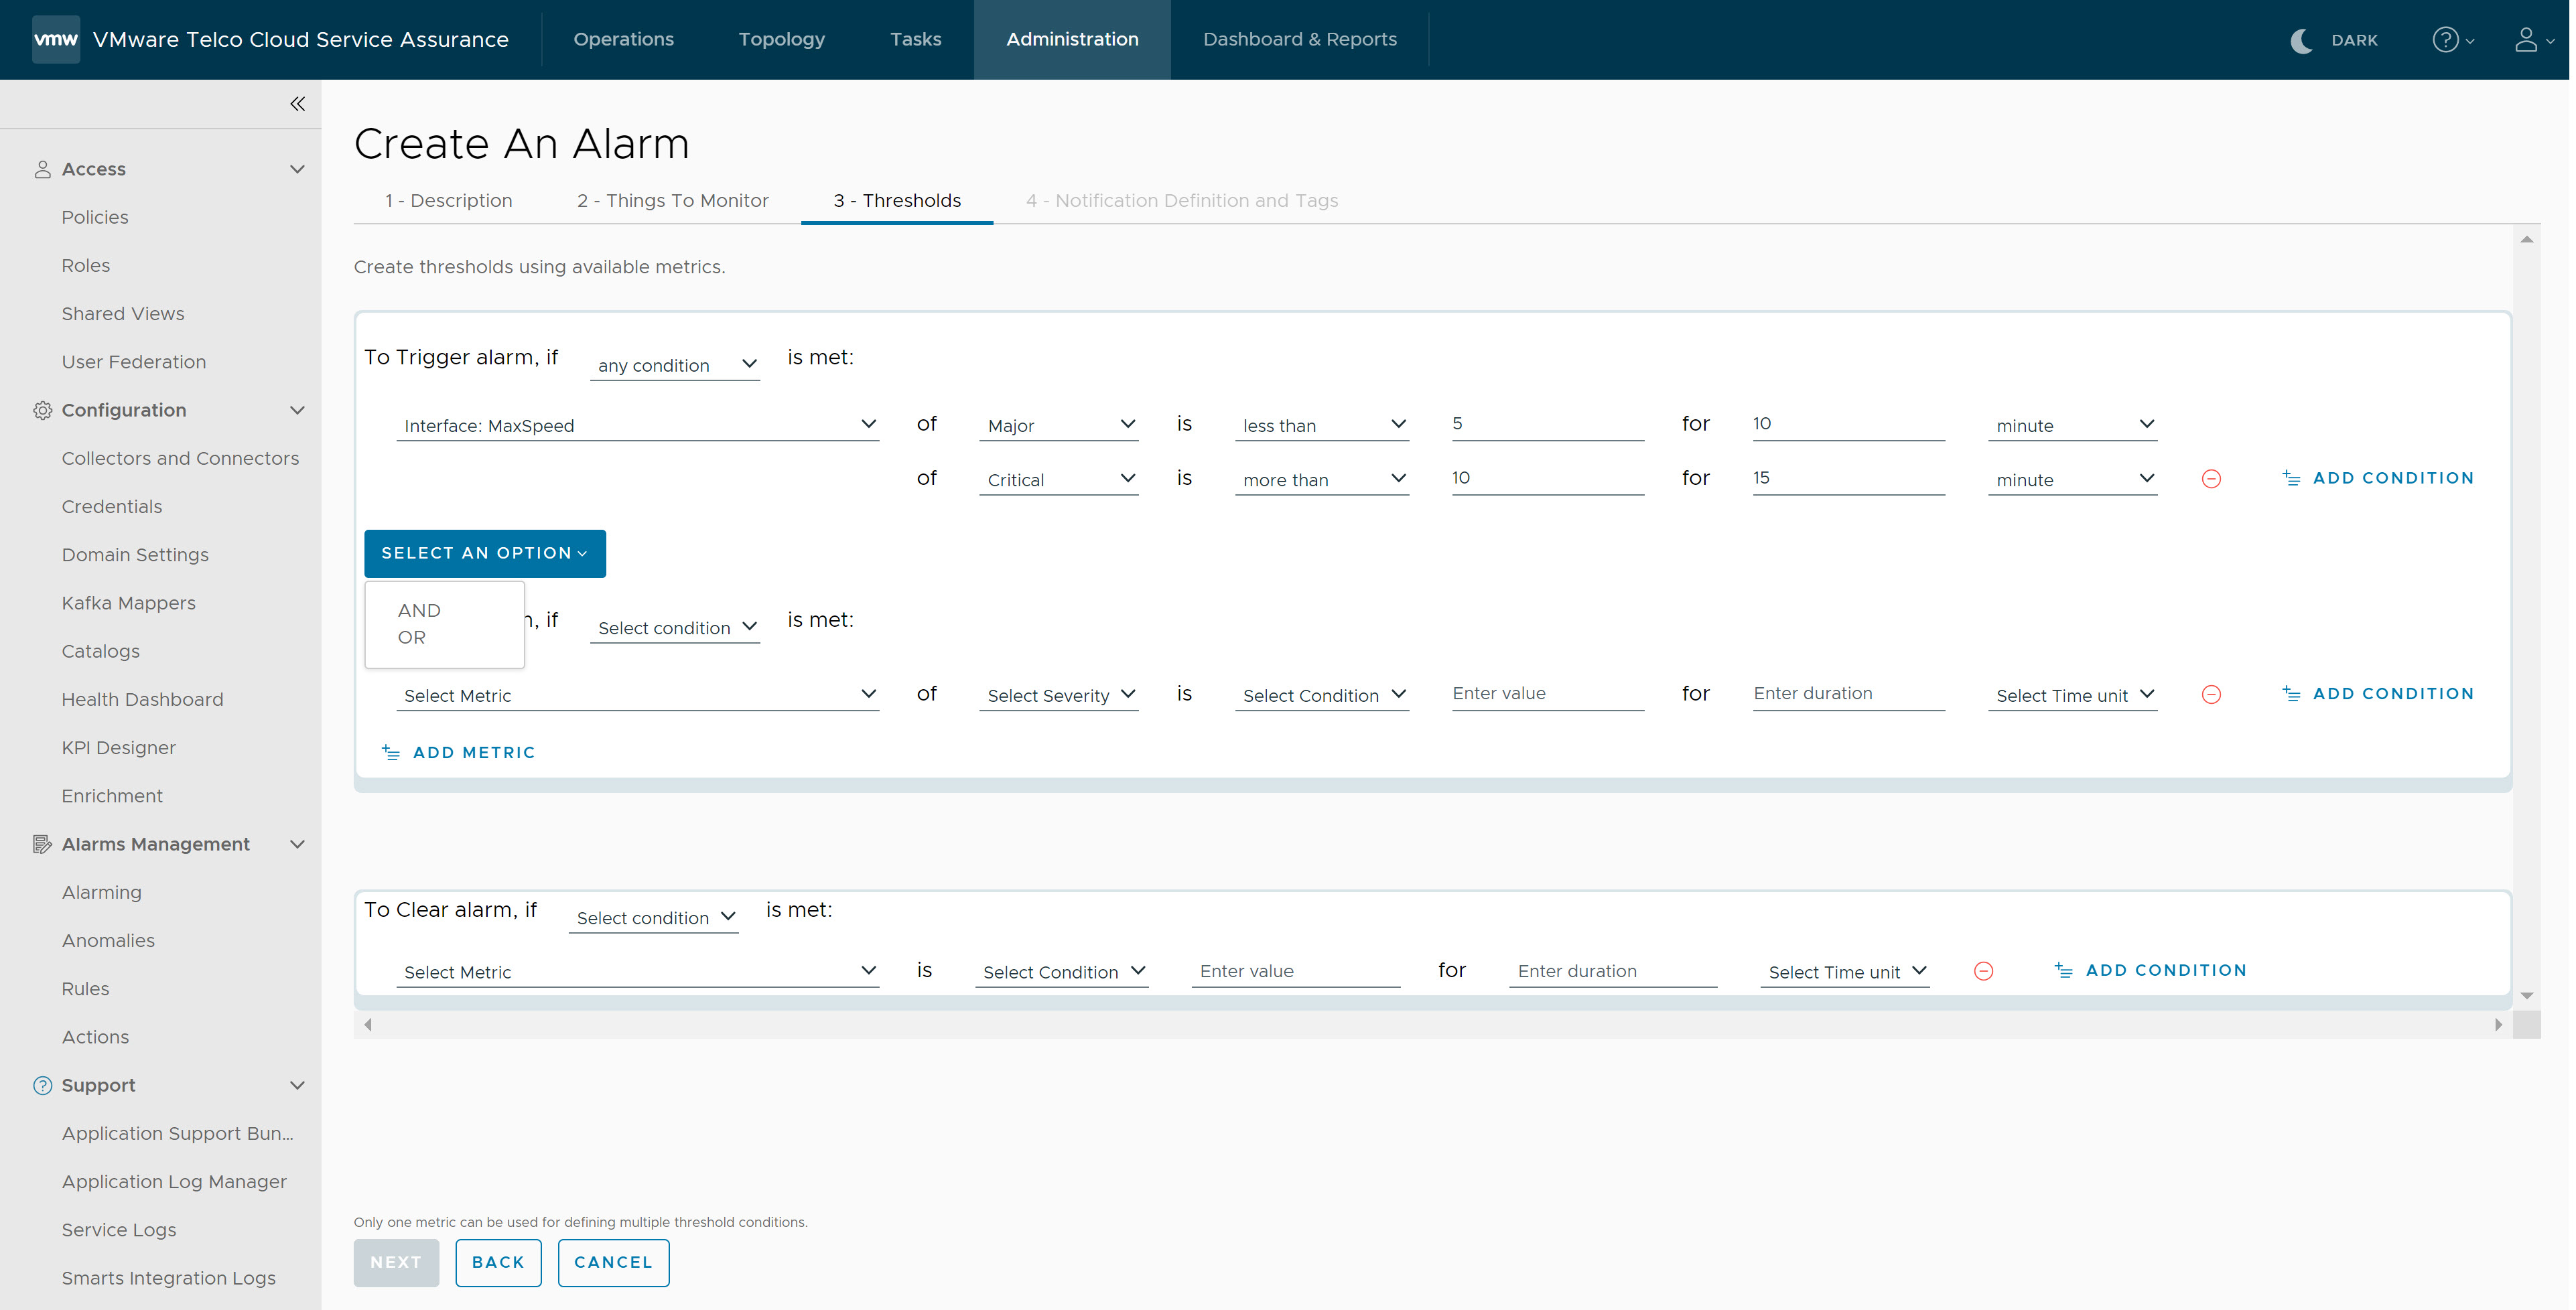
- Click Next.
- Under Notification Definition and Tags, provide the notification and tag definition details.
For Notification Definition, update the following fields:
- Event Name: Provide a name for the event.
- Description: Provide a description for the event. This field is optional.
- Select Category, Class Name, Instance Name, and Source. These fields can have mapped or static values.
Note: Ticket ID is an optional field.
- Select Event Type. This field can have two values Momentary or Durable. If the event type is Momentary, you must enter the Duration value and select the duration.
The duration field enables automatic deletion of notifications. Momentary notifications are automatically cleared based on the specified time duration. Any update to the momentary notification before the automatic deletion period may restart the time period.
Every notification is identified with a Class Name, Instance Name, Event Name, and Source. Make sure that you map the correct values with the notification definition fields. Use the durable field for the automatic deletion of notifications. The value of the source field must match between notifications and clear notifications.For Tag Definition, select one or more User Defined Tags and map the values to the user-defined fields in the alarm messages. This field is optional.Values appears in drop-down when you enter empty space, select Single Tag or Multiple Tags separated with space with any combination of static text separated by a space.
Note: The availability of the properties and tags in the drop-down menus may take time upto 60 seconds based on the filters and metrics selected.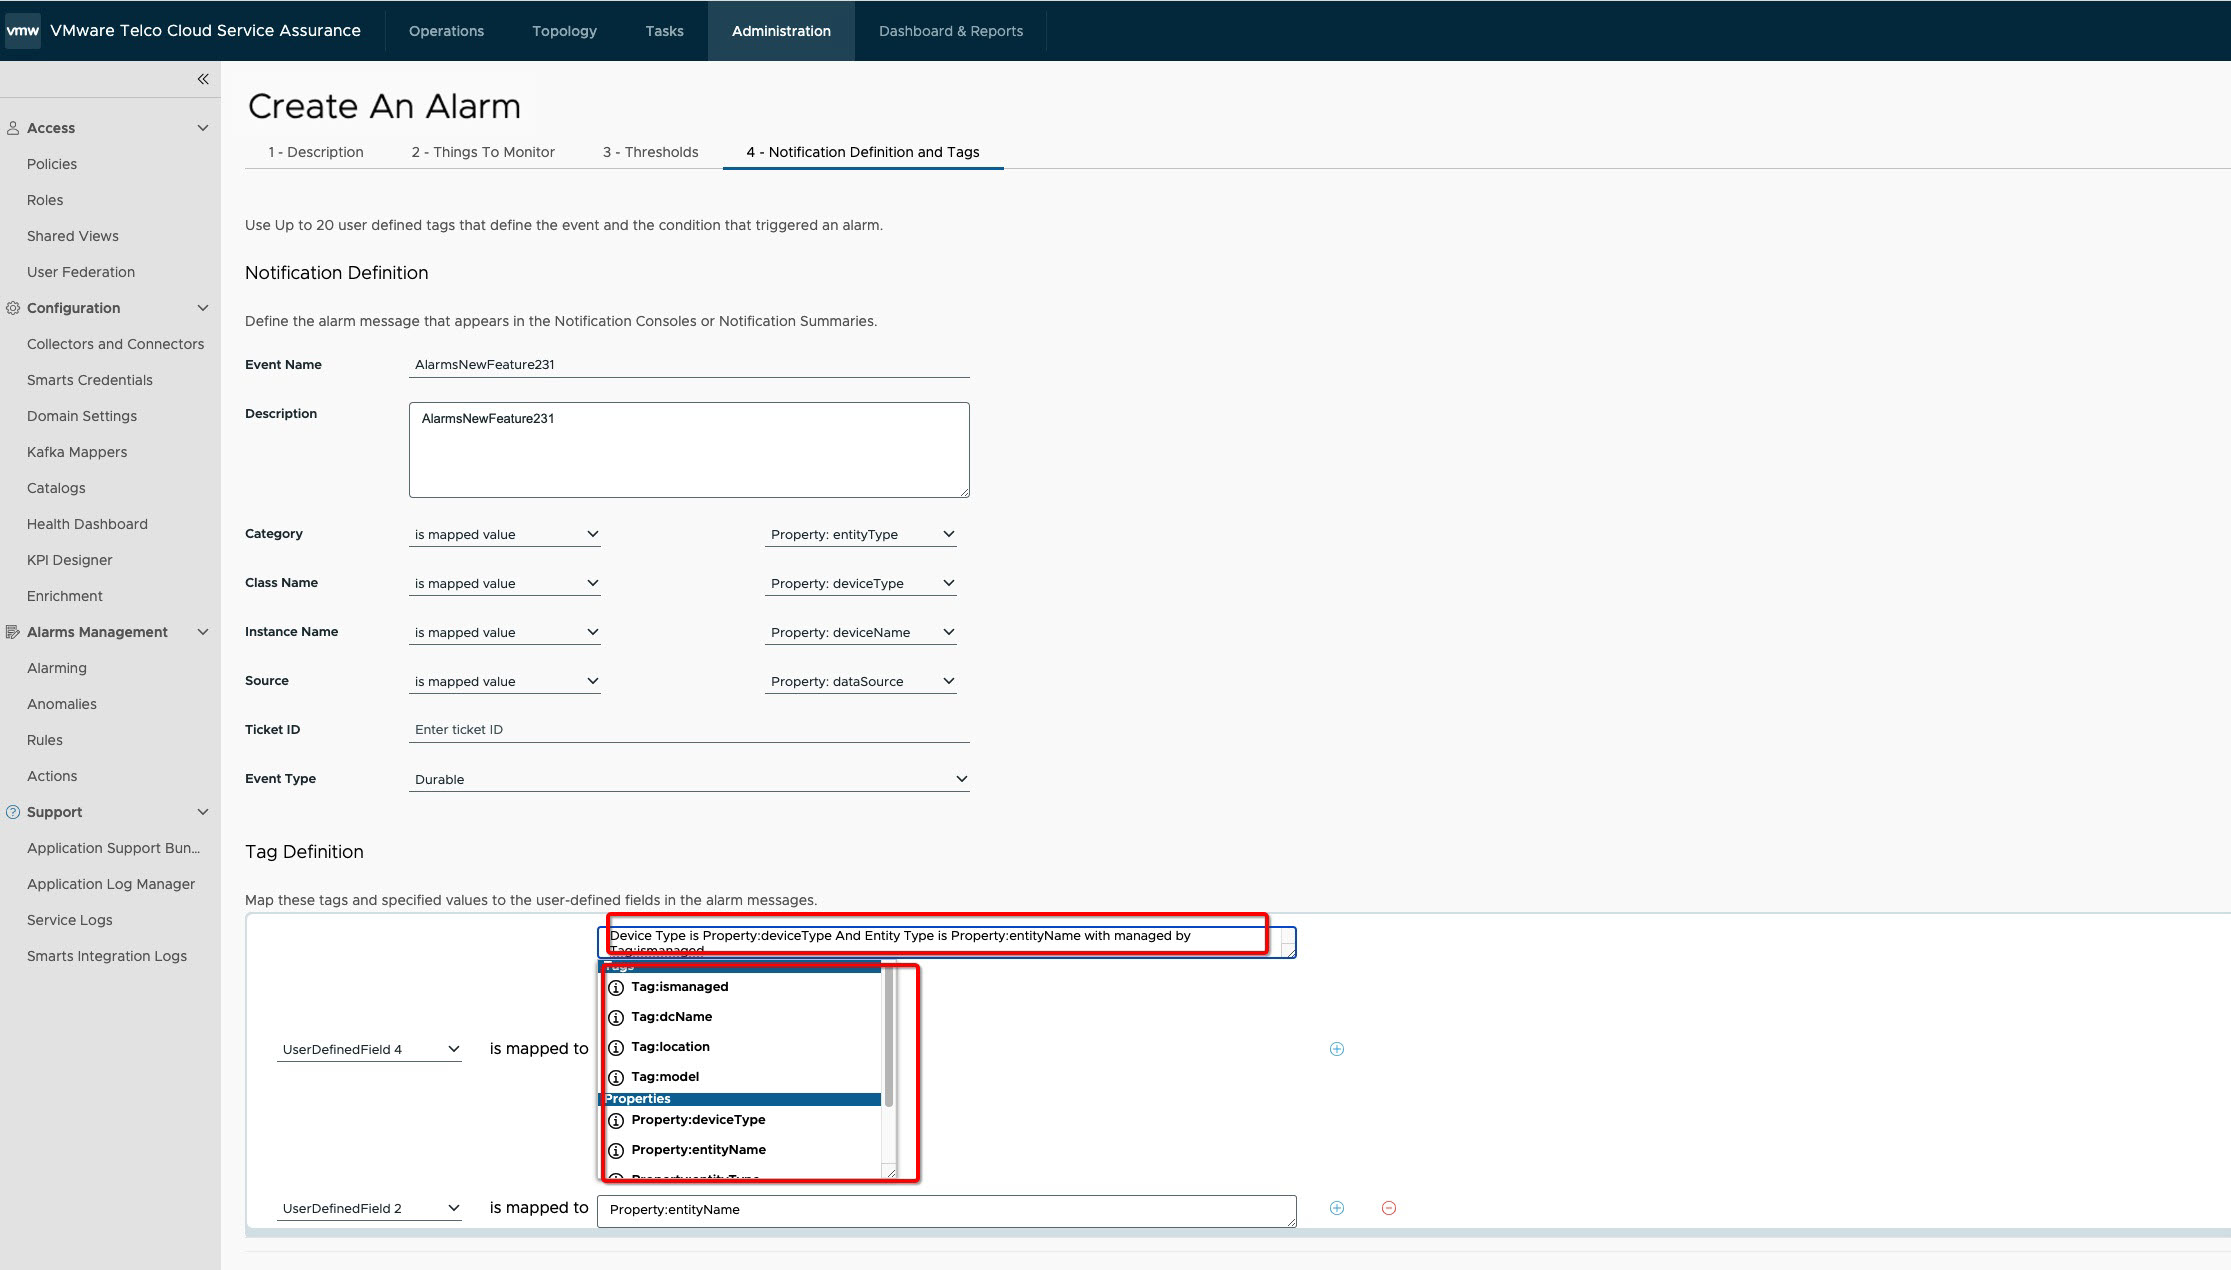
- Click Finish.
After an alarm is triggered, you will receive a notification in the Default Notification Console window.
To see the details of the condition that has triggered the alarm:- Navigate to Operations > Notification Console > Default Notification Console.
- In the Default Notification Console window, click the notification that you received after an alarm is triggered.
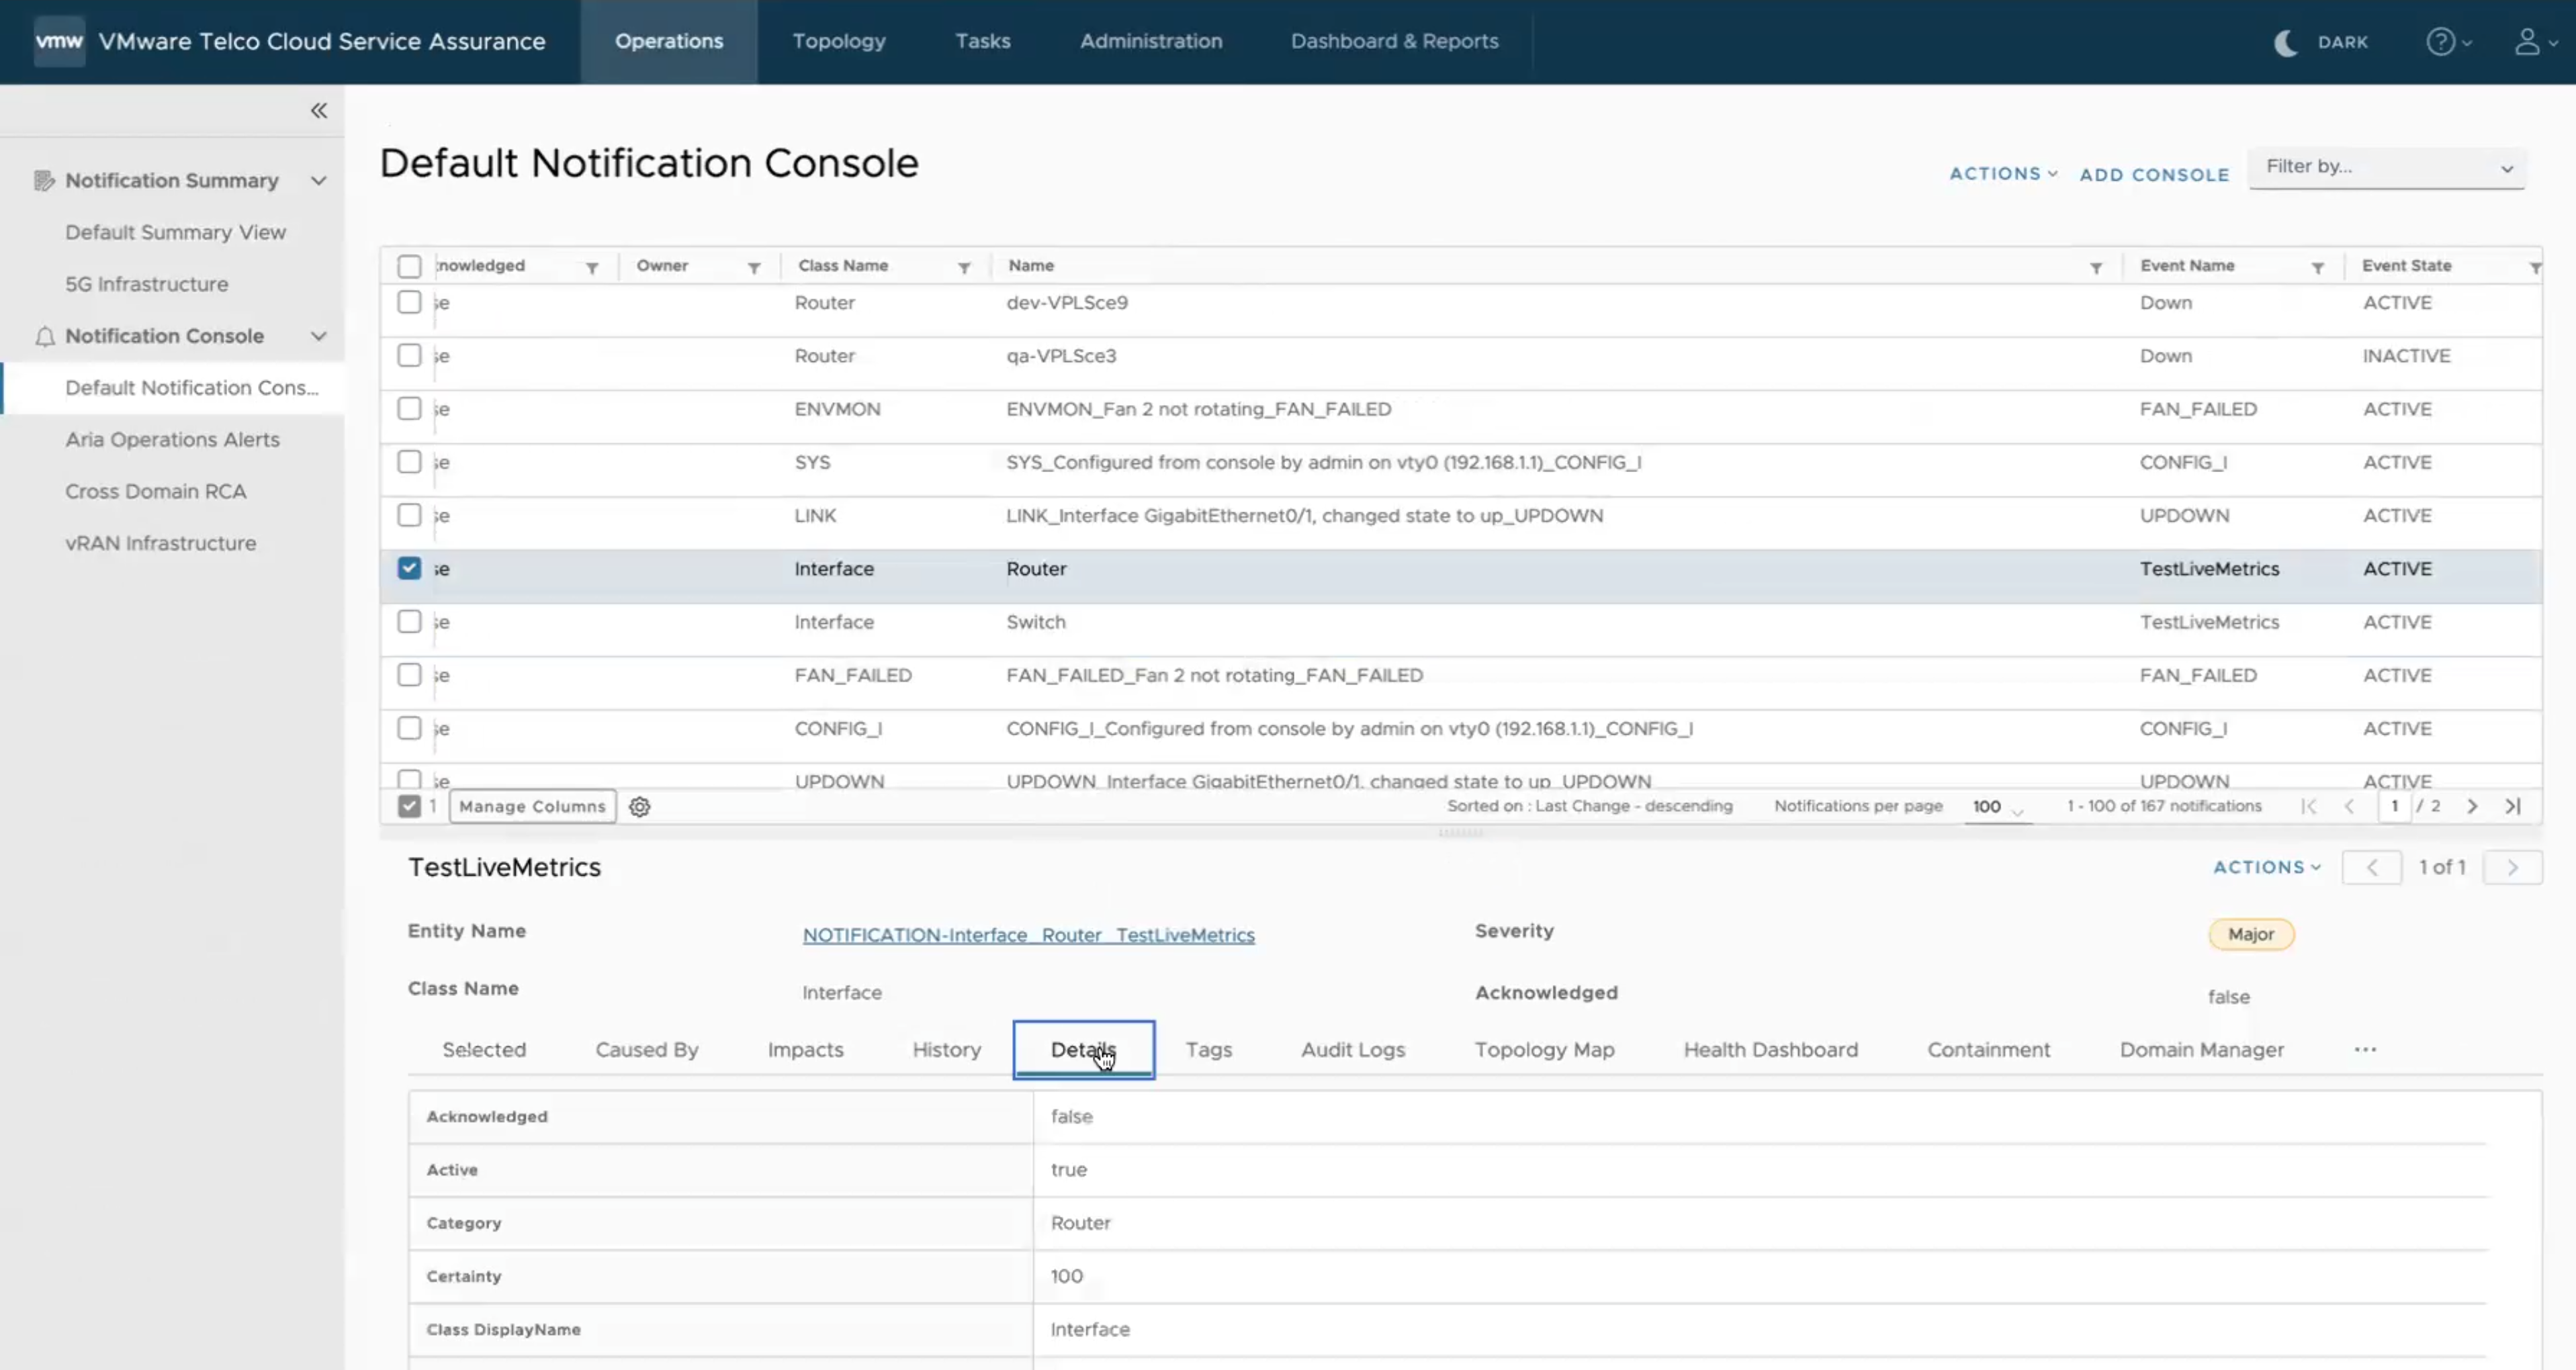
- Click the Details tab.
- Scroll down upto the Event Text field to find the details of the condition that has triggered the alarm.
Note: The Event Text field has the entire condition that has triggered the alarm.
