This section helps you in creating a Health Dashboard.
Procedure
- Go to https://<Telcocloud serviceassurance-ui-IP.
A typical URL for logging in to the user interface from the same system on which VMware Telco Cloud Service Assurance is installed is, https://10.x.x.x.
- Enter username and password.
- Click Next.
- Click Dashboards & Reports.
The Grafana homepage appears.
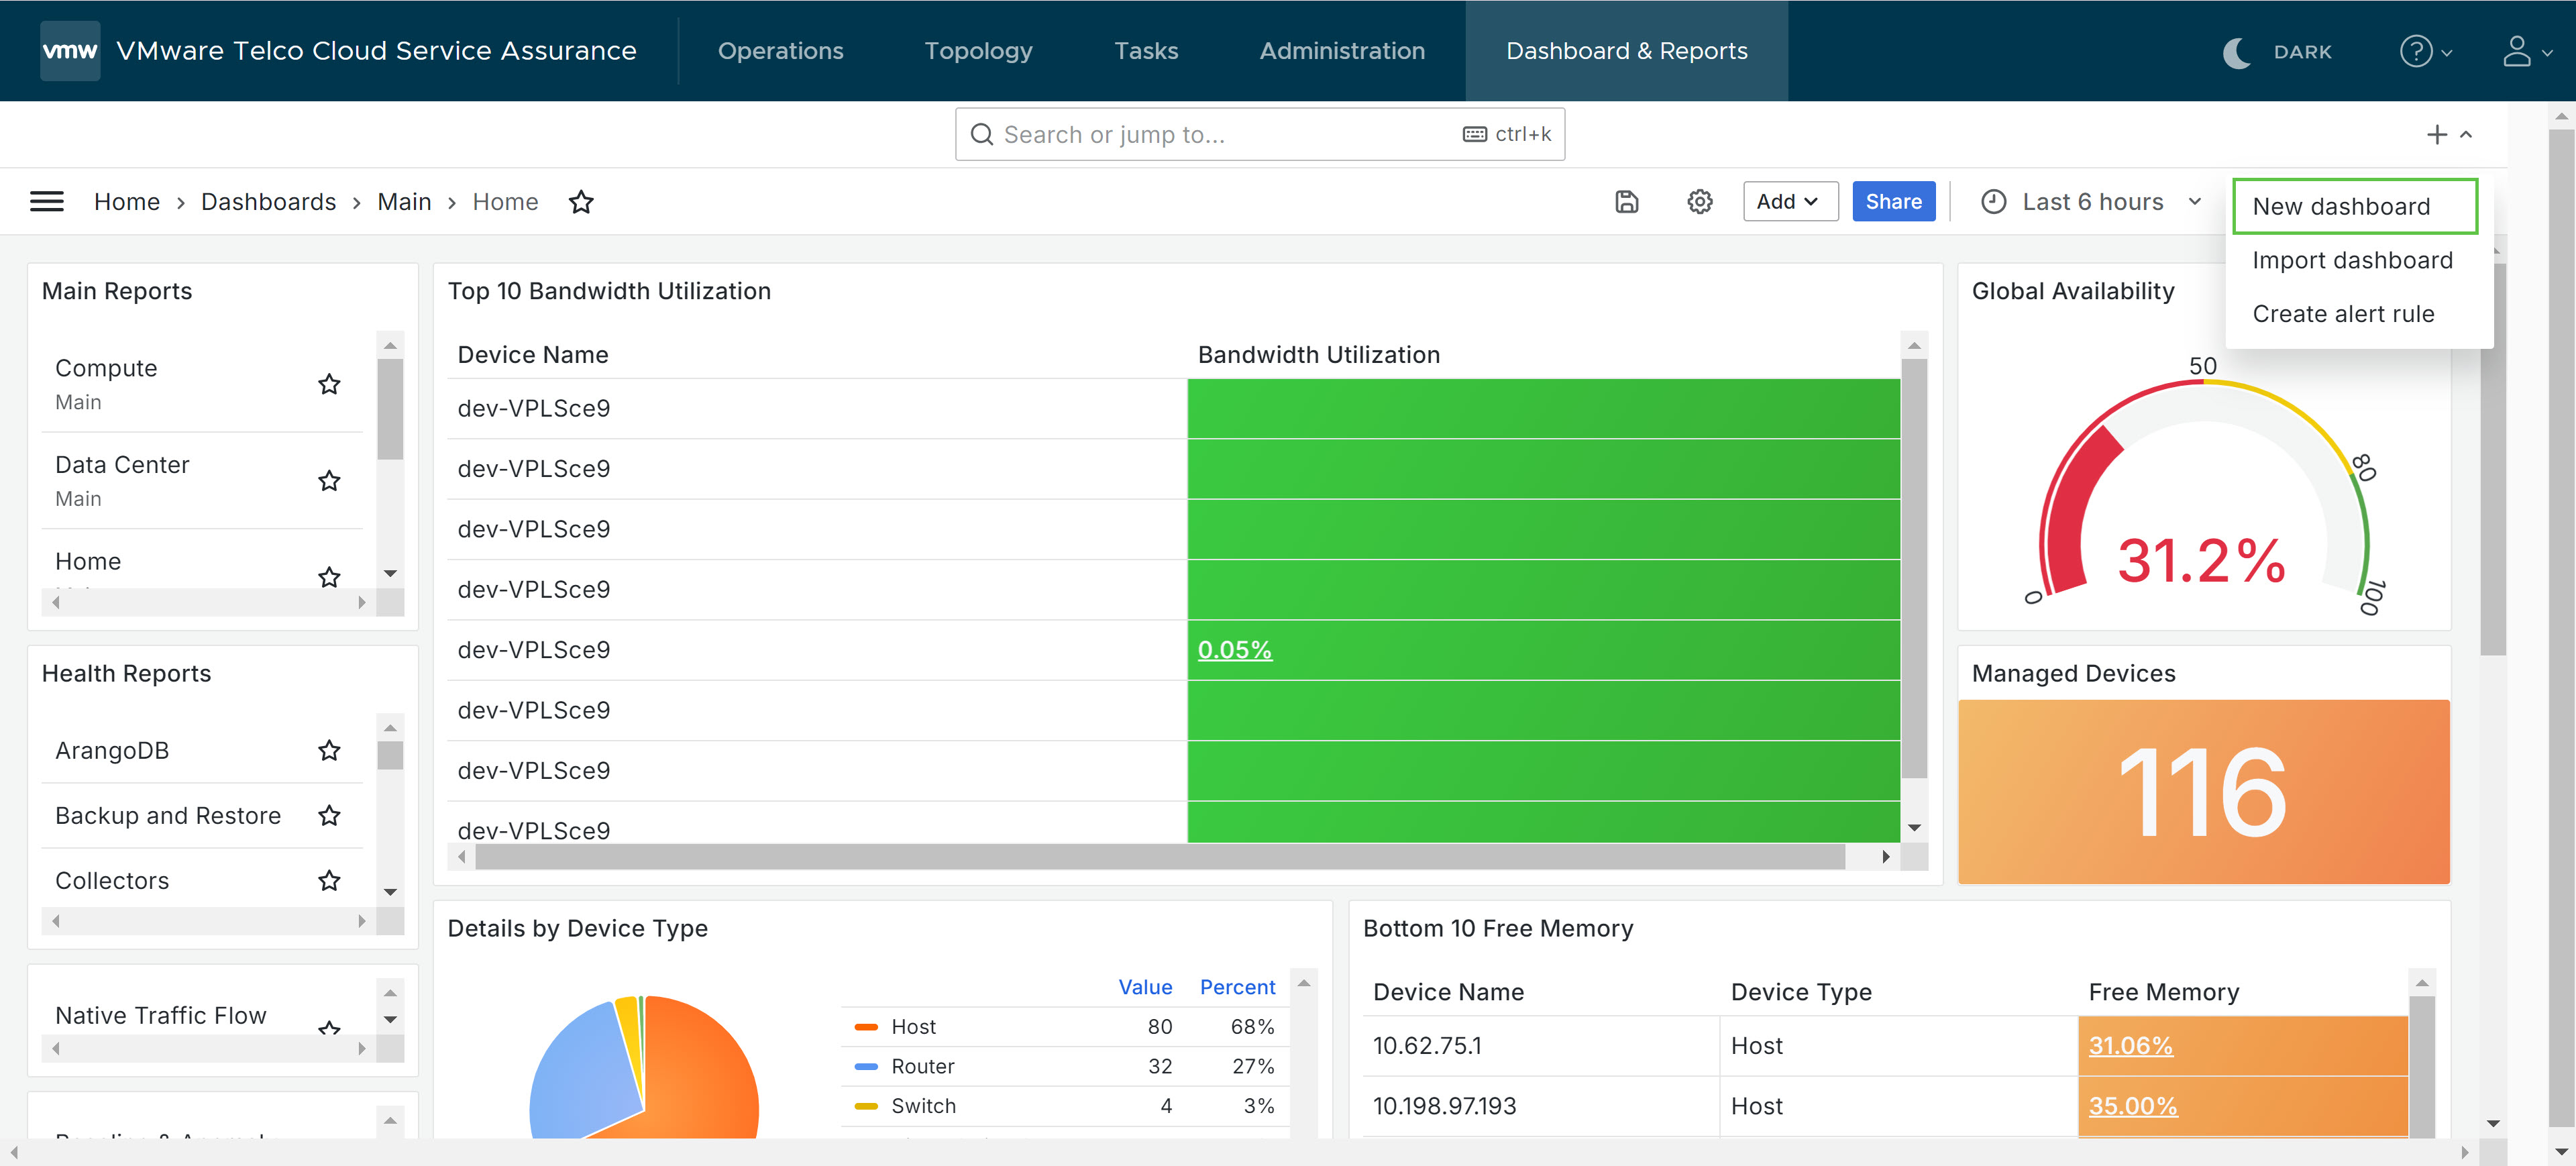
- On the Grafana homepage, click the + icon.
- Click New Dashboard.
- Click Add Visualization.
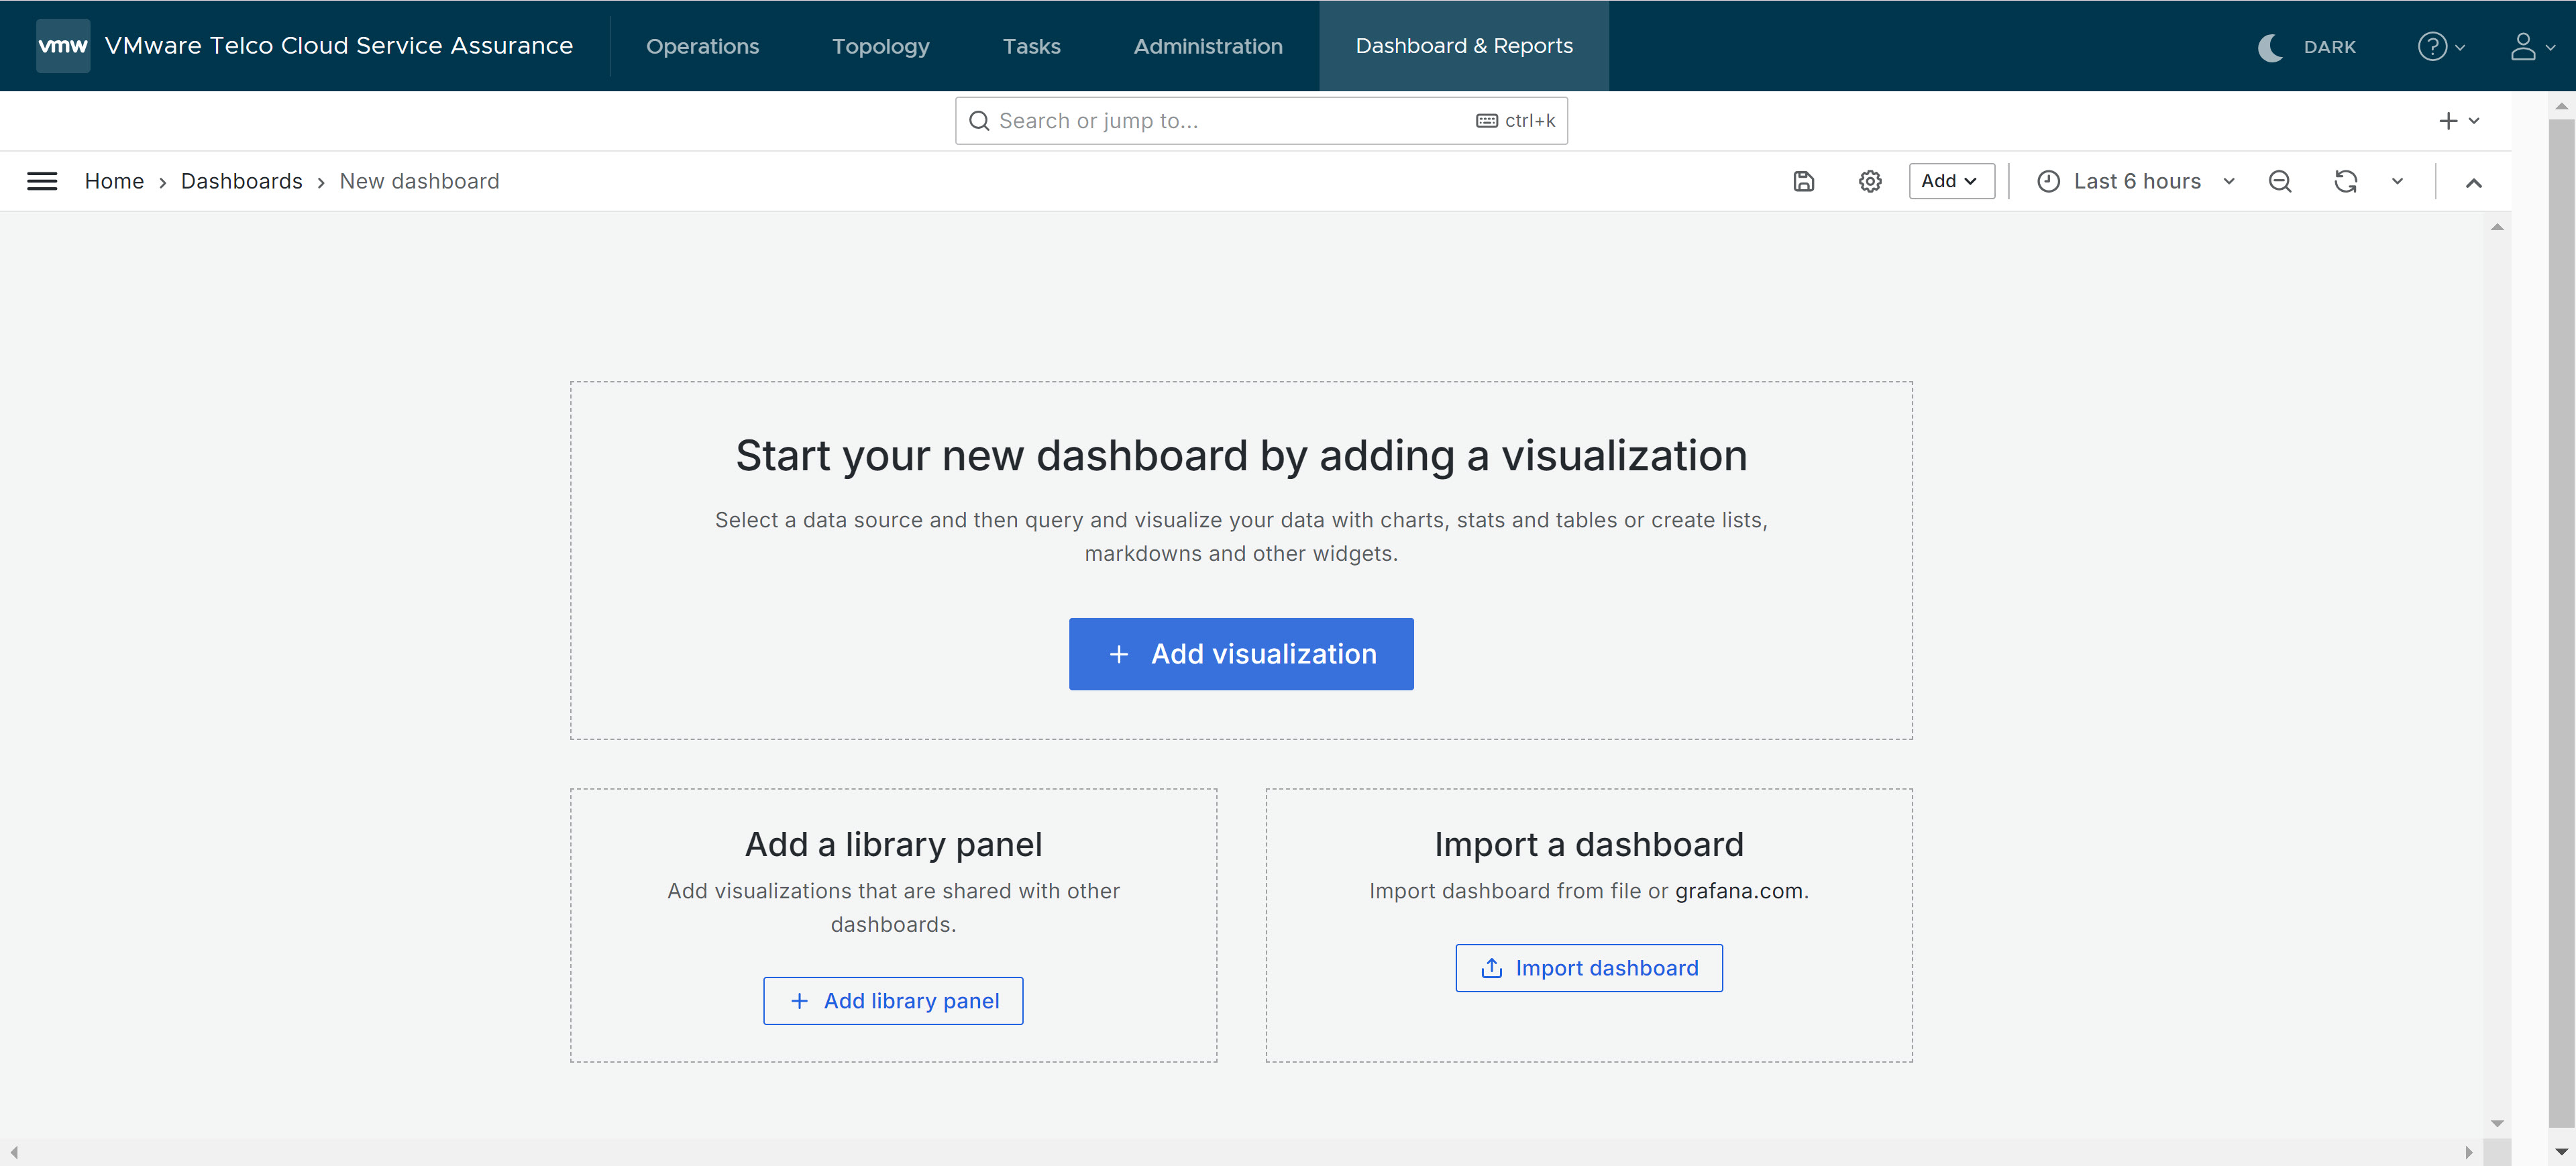
- In the Select Data Source search box type and select the data source. For example, Network-Interface.
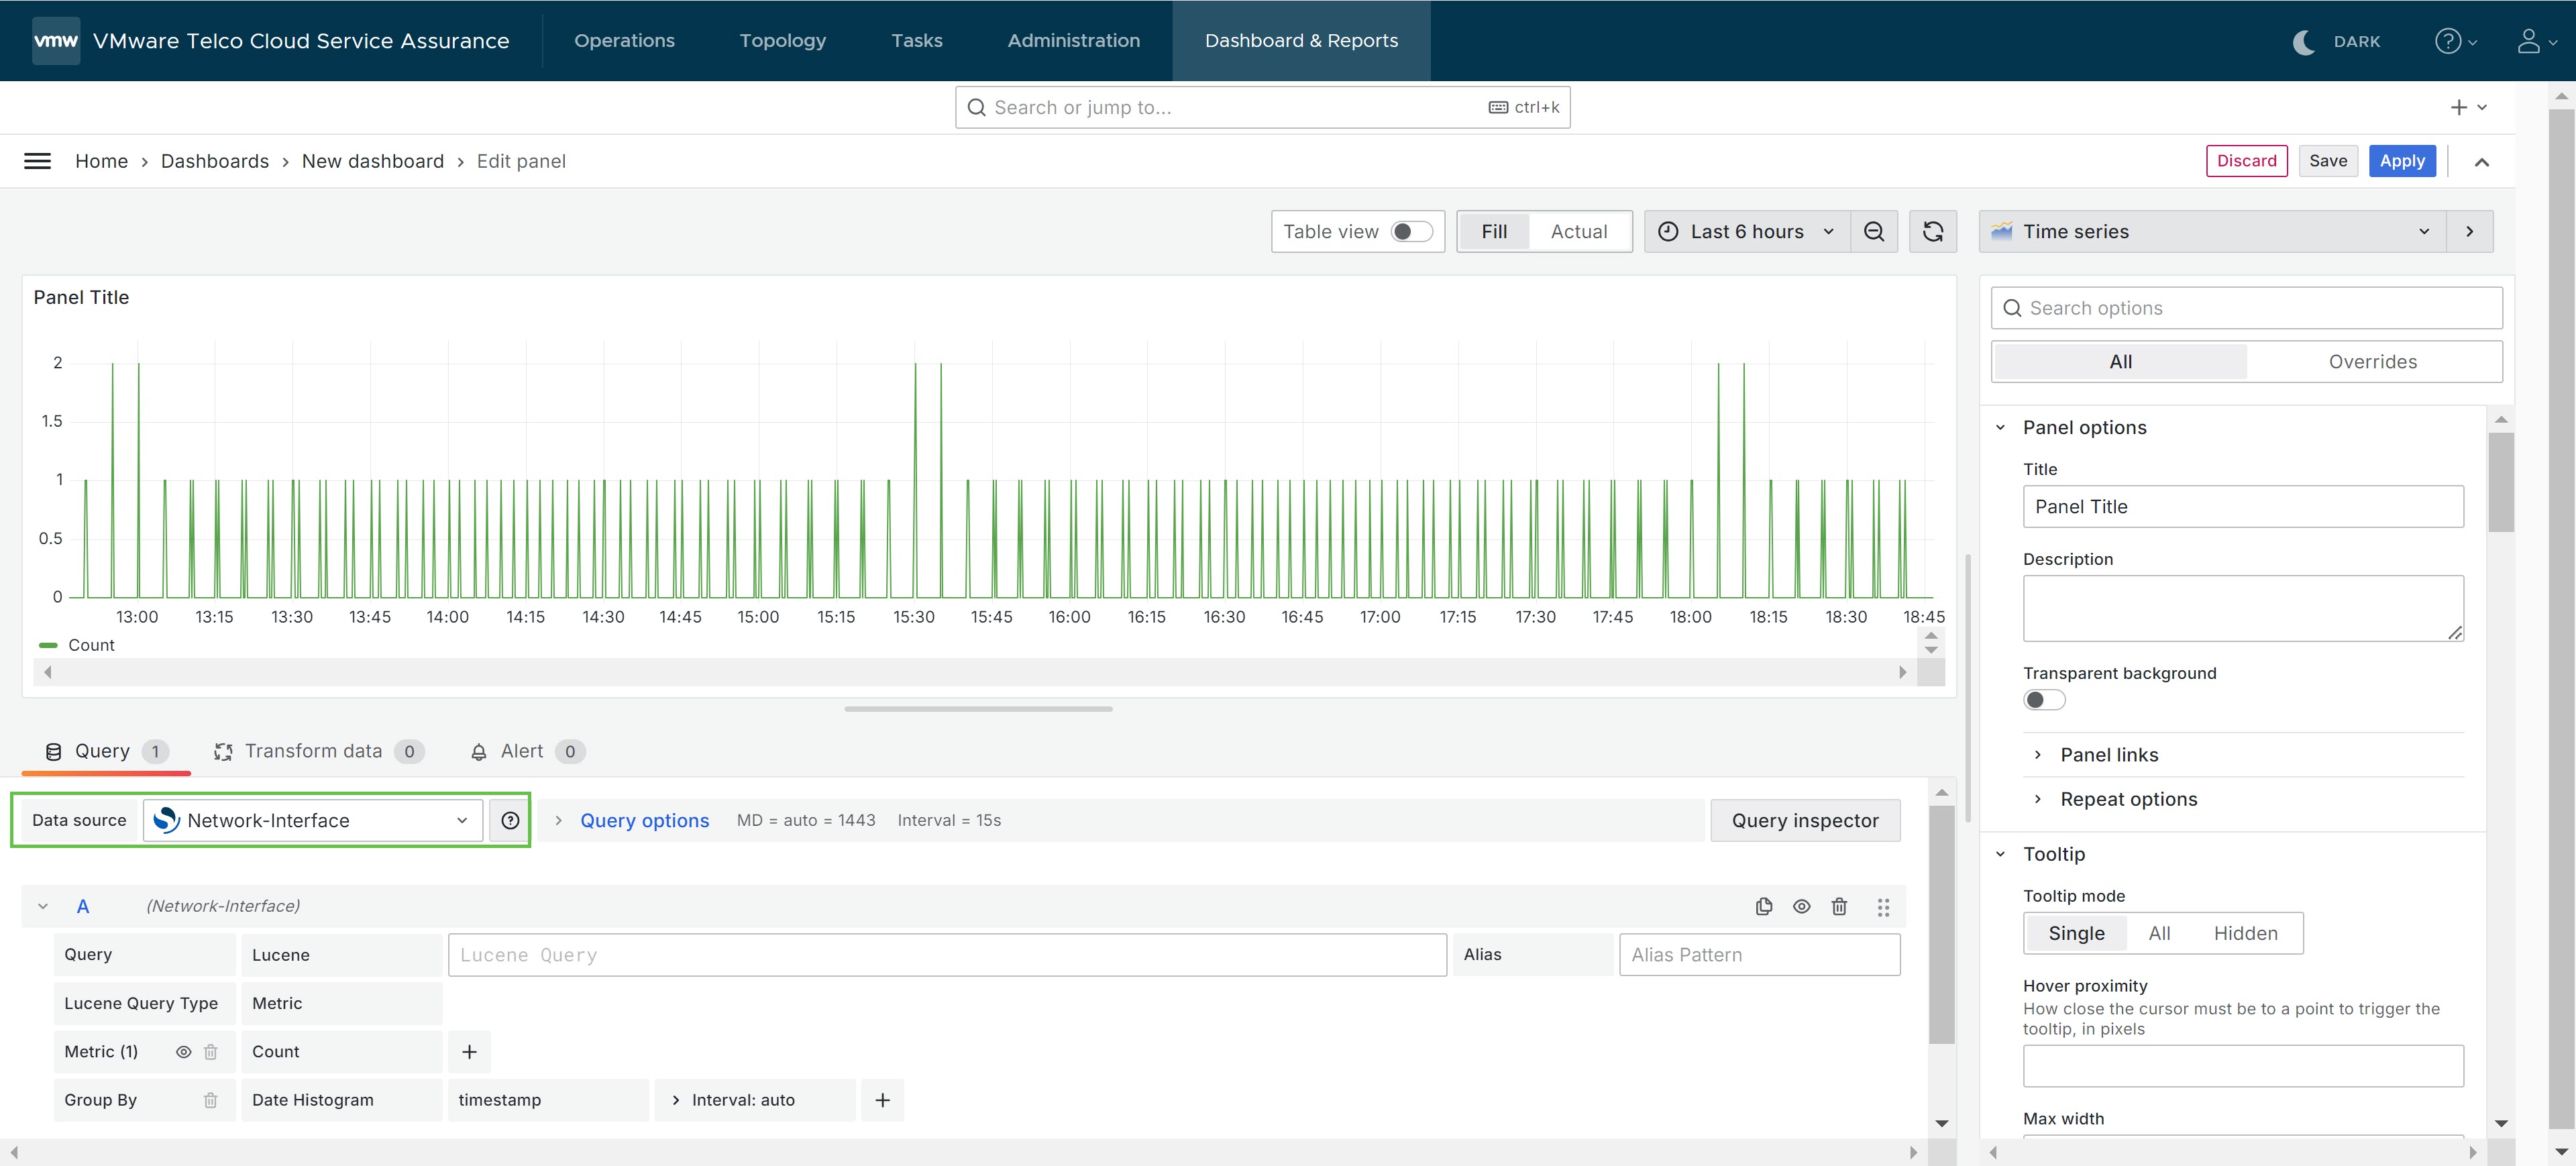
- Click the Visualizations tab and select a vizualization type.
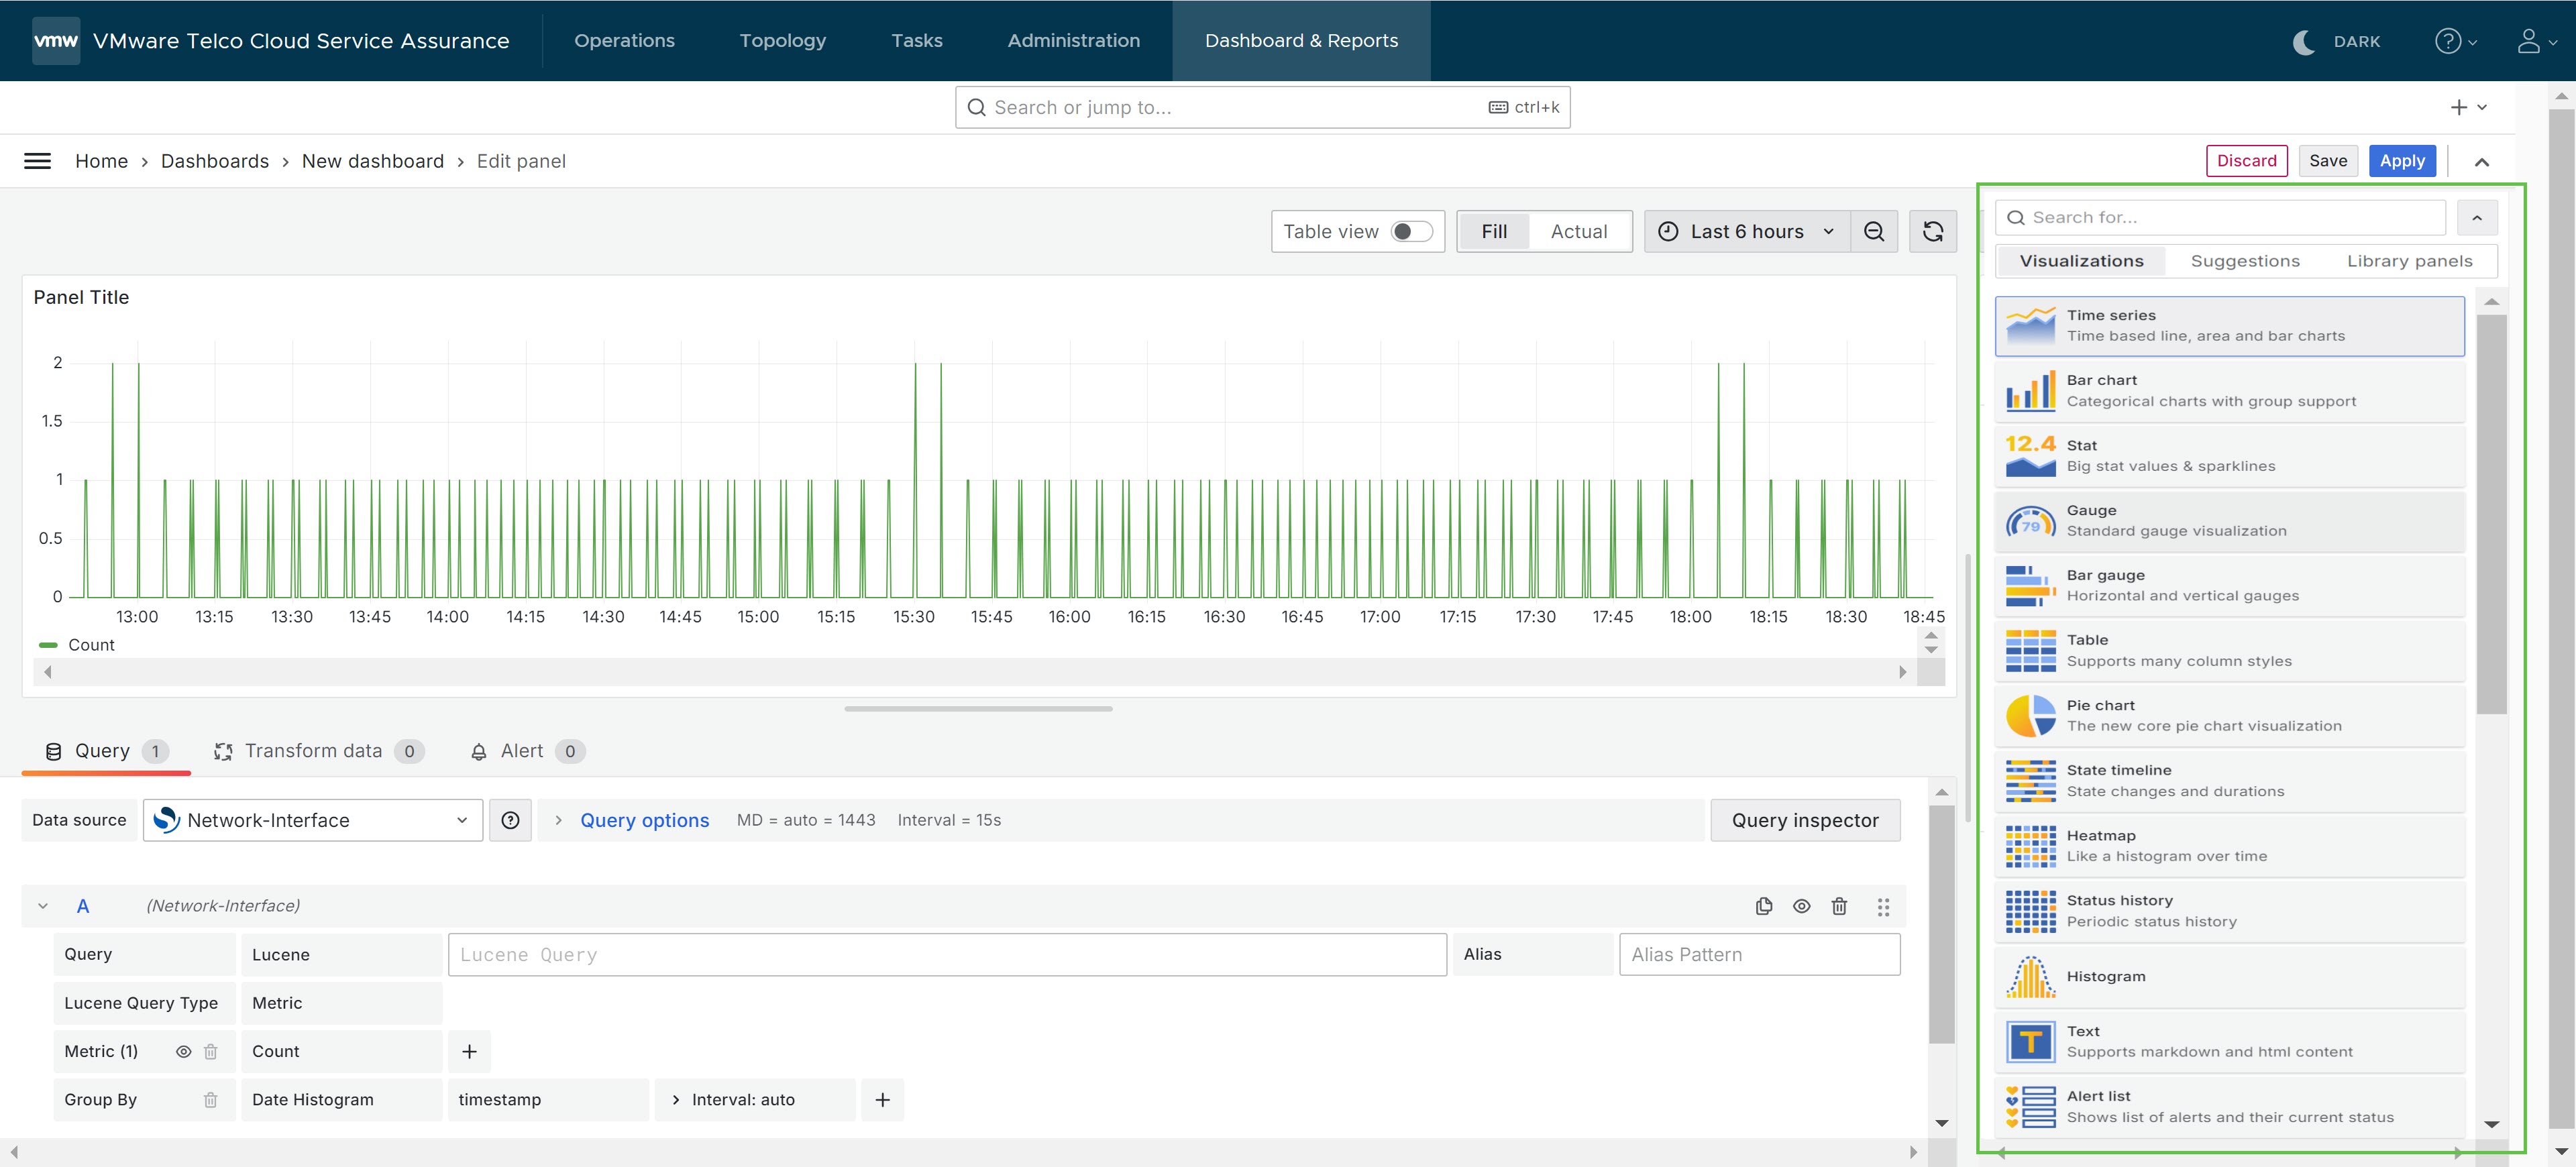
- In the Query field, define the query as required. For example, Lucene.
- In the Metric field, select the required metrics. For example, CurrentUtilization.
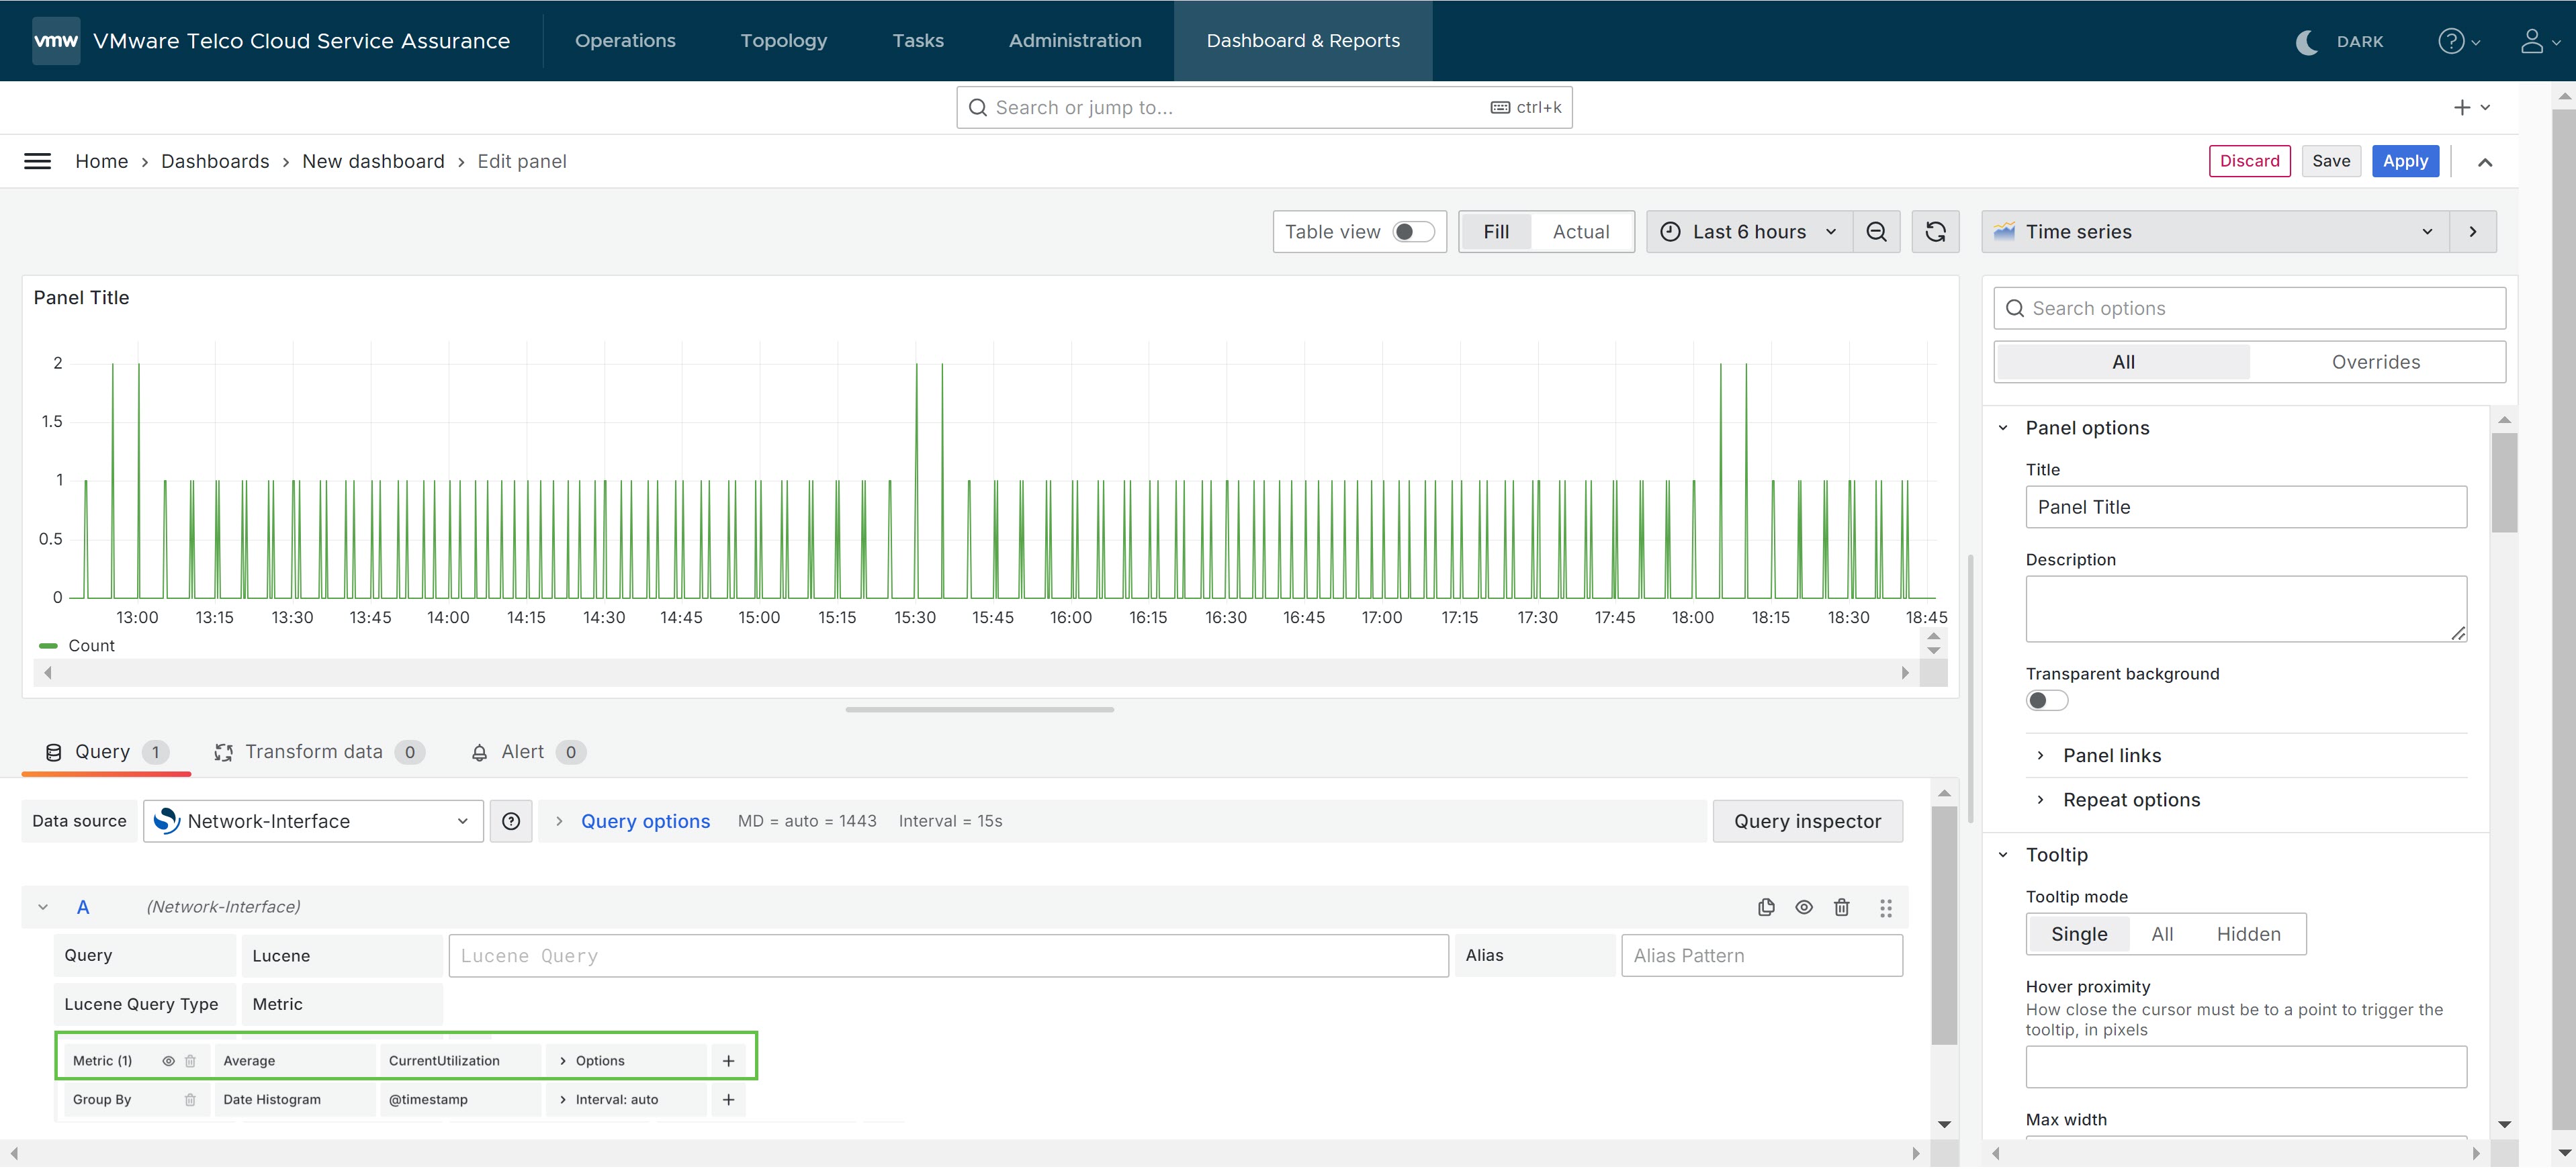
- In the Group by field, select the required parameters. For example, Date Histogram, @timestamp, and Interval: auto.
- On the right pane, in the Panel Options section, enter the panel title, description, and other required fields.
- Click Save.
The Save Dashboard dialog window appears.
- In the Title field, enter a name for the dashboard.
- In the Description field, enter a description for the dashboard.
- From the Dashboards drop-down menu, select a dashboard to save the report.
- Click Save, to save the report to the dashboard.
The dashboard is created.Note: While developing dashboards that will be used for Health dashboard, it is essential to create and use the following dashboard variables:
- DeviceName
- ManagedEntity
When the Health Dashboard is launched in context of a selected Notification or Topology entity, the DeviceName and ManagedEntity values are passed to the Health Dashboard.
- Click the settings icon
 .
.
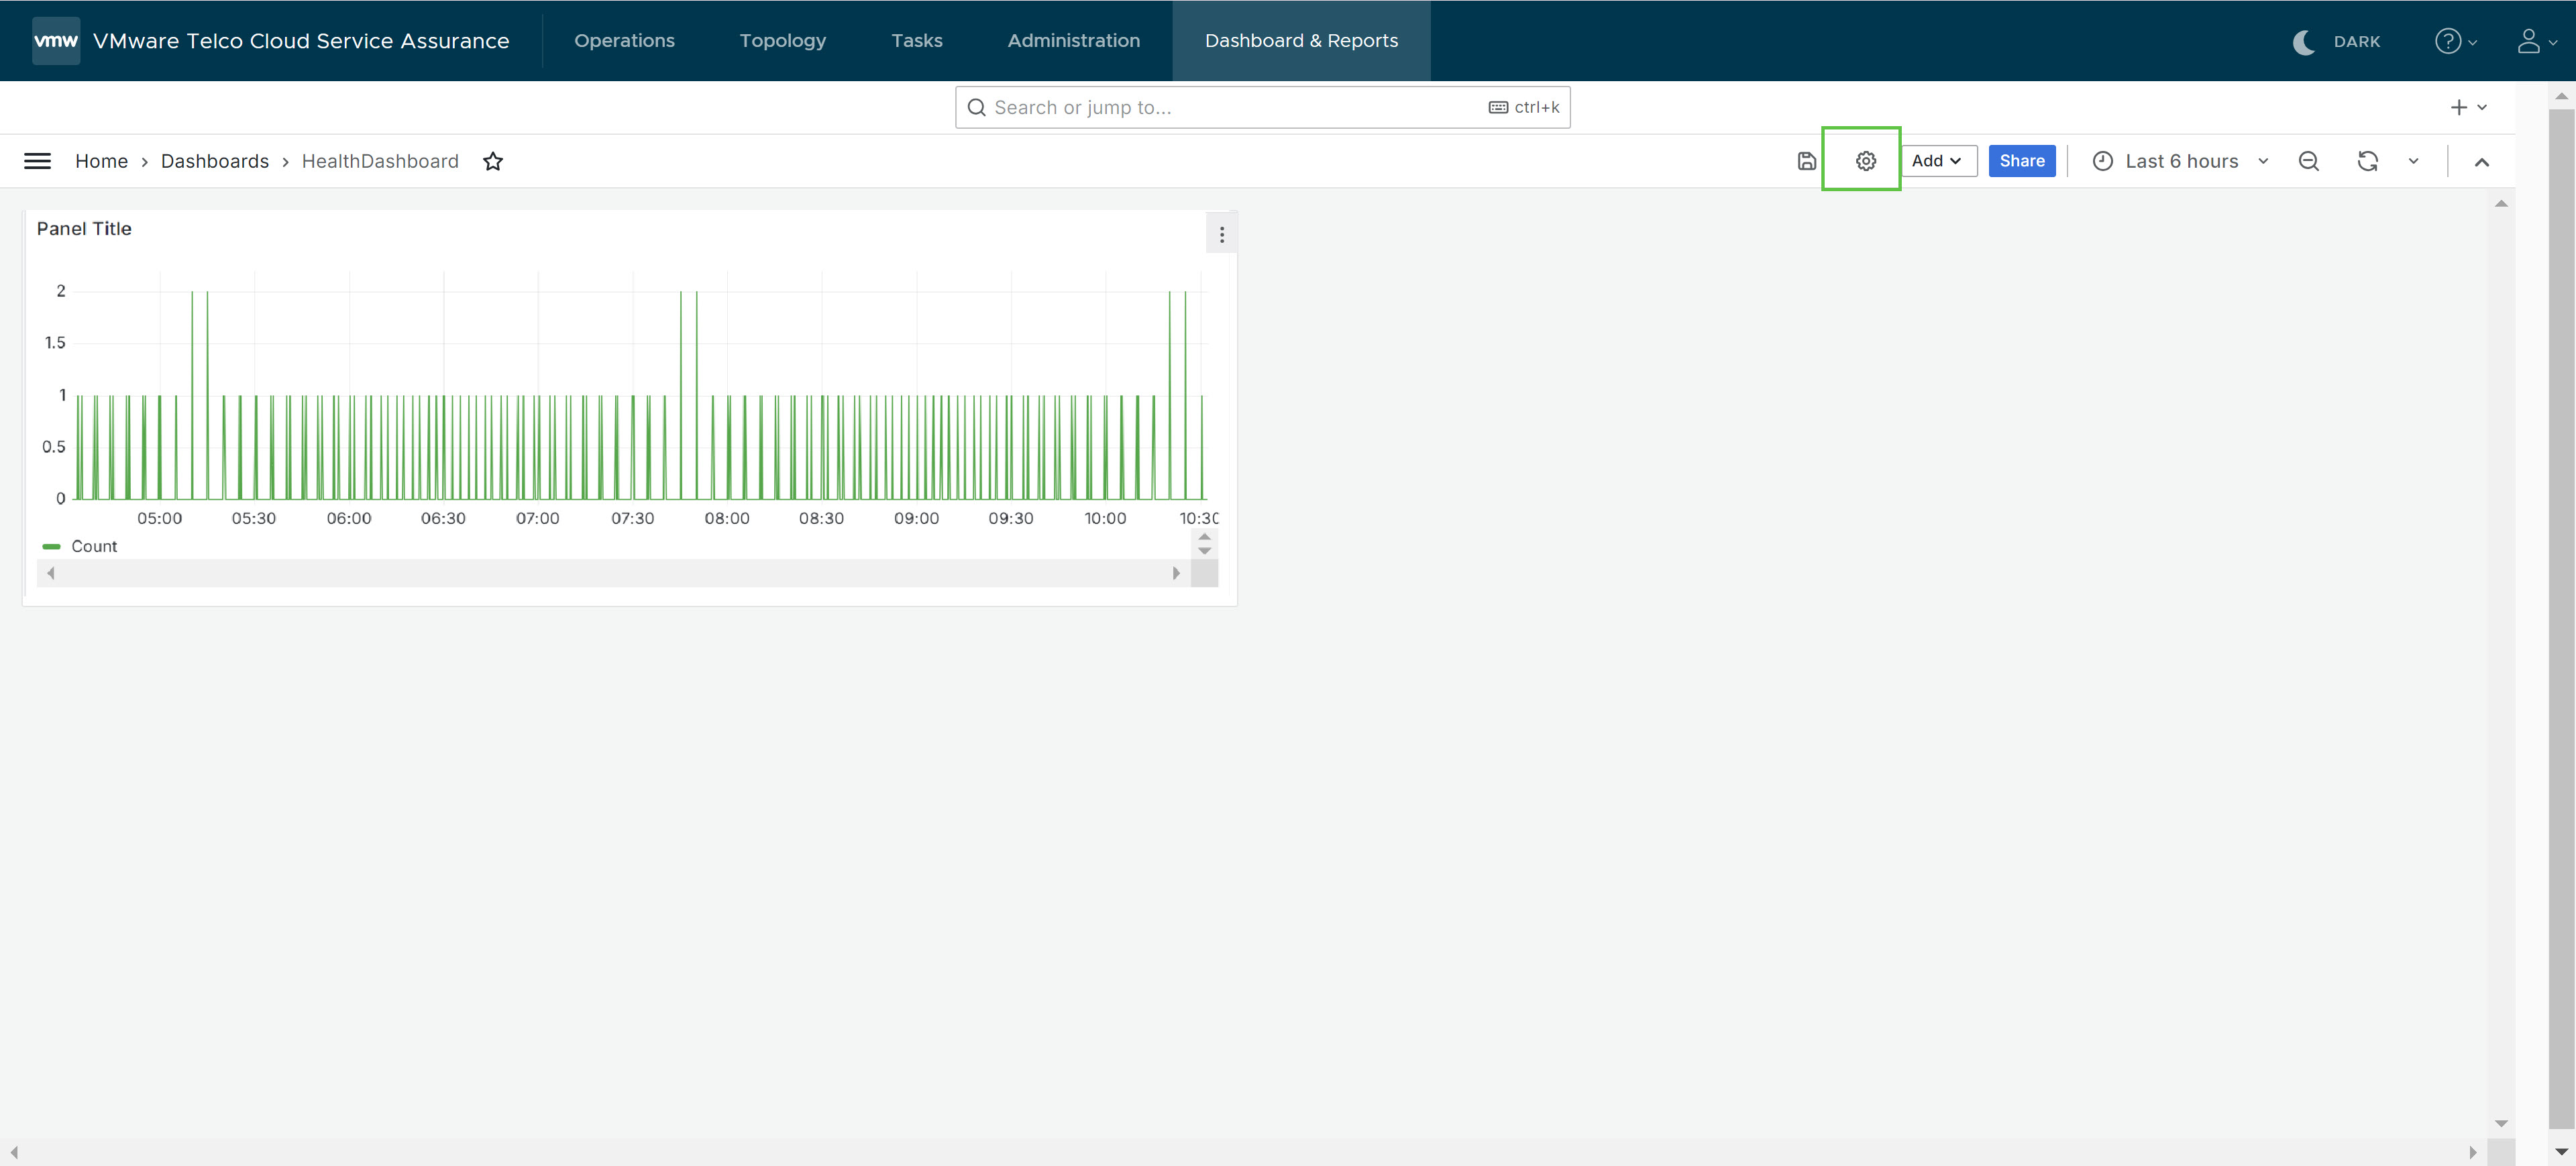
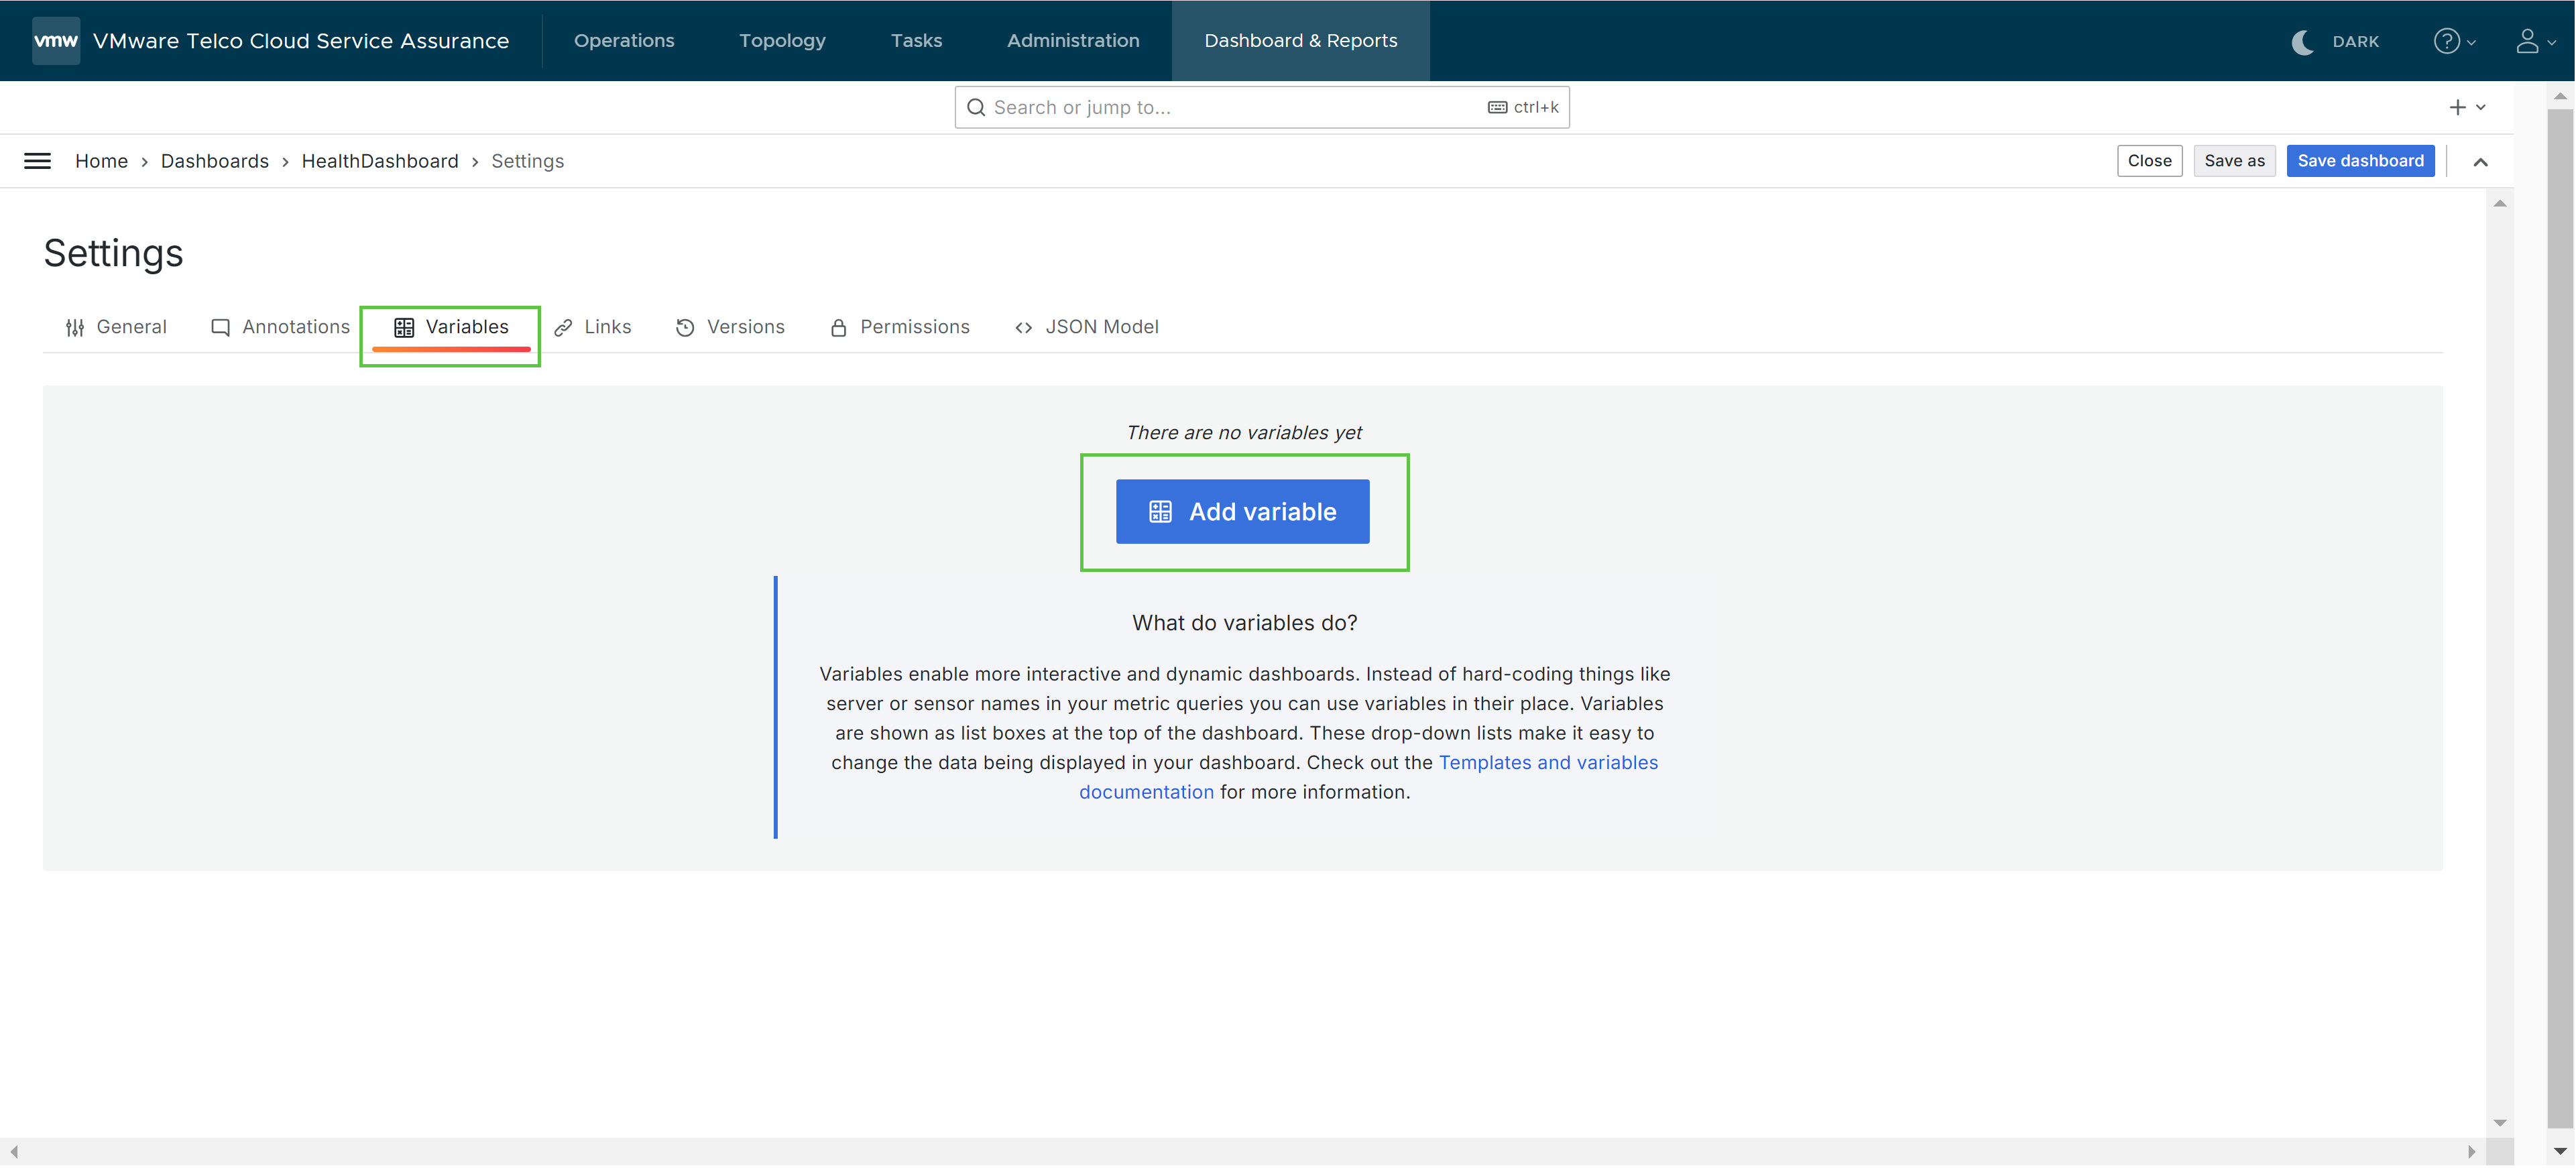
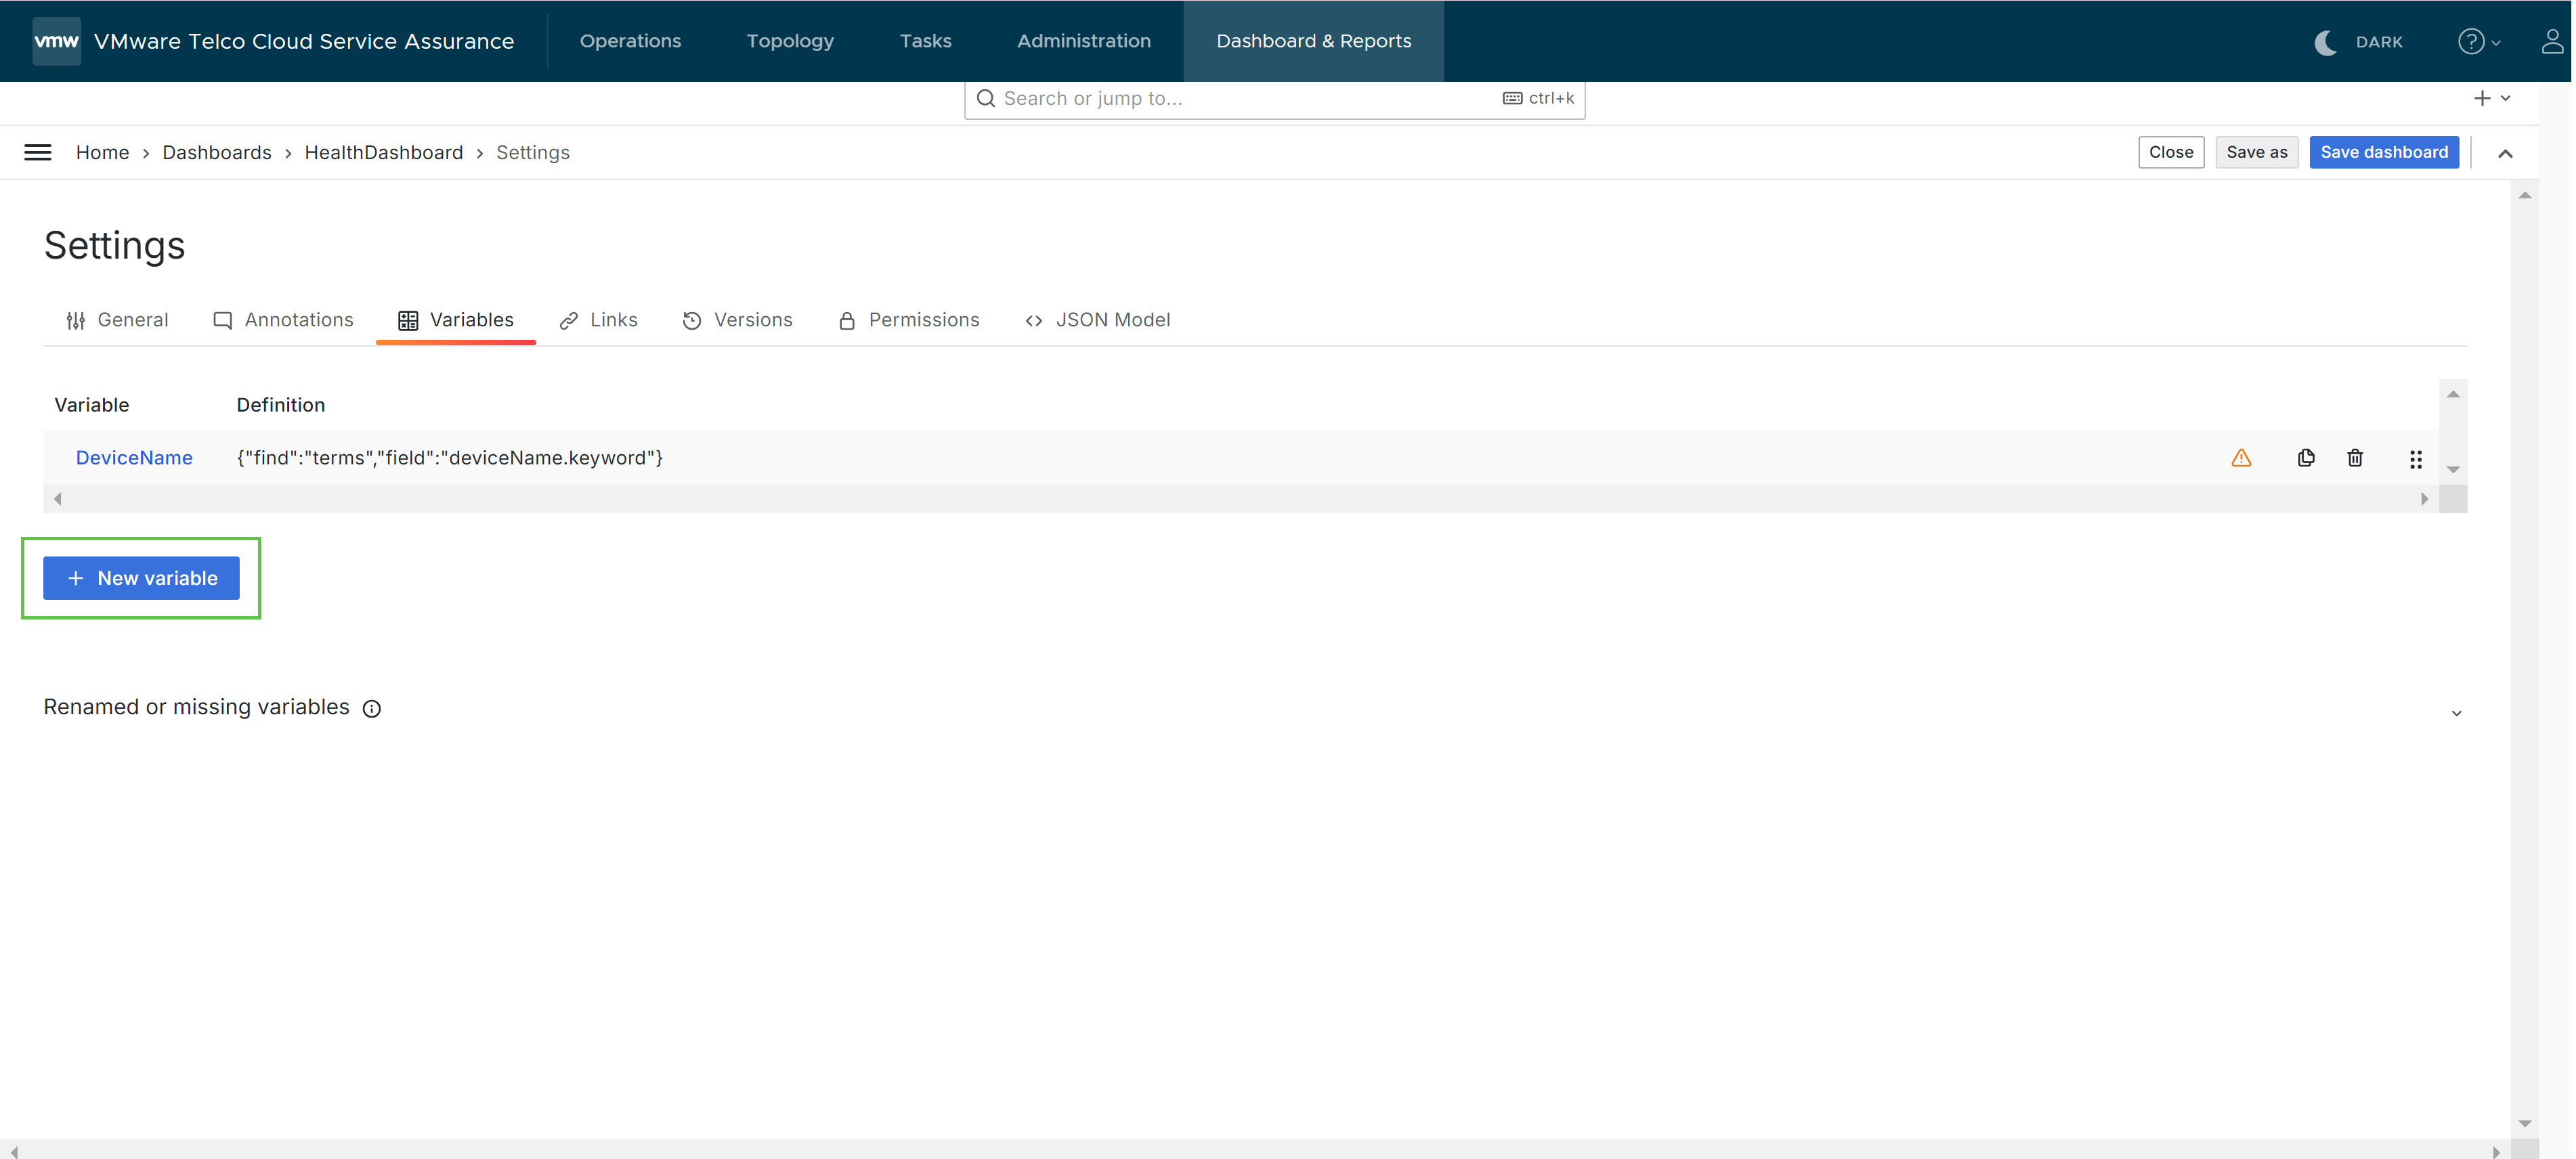
- Click the Variables tab.
- Click Add Variable.
- From the Select Variable Type drop-down menu, select Query.
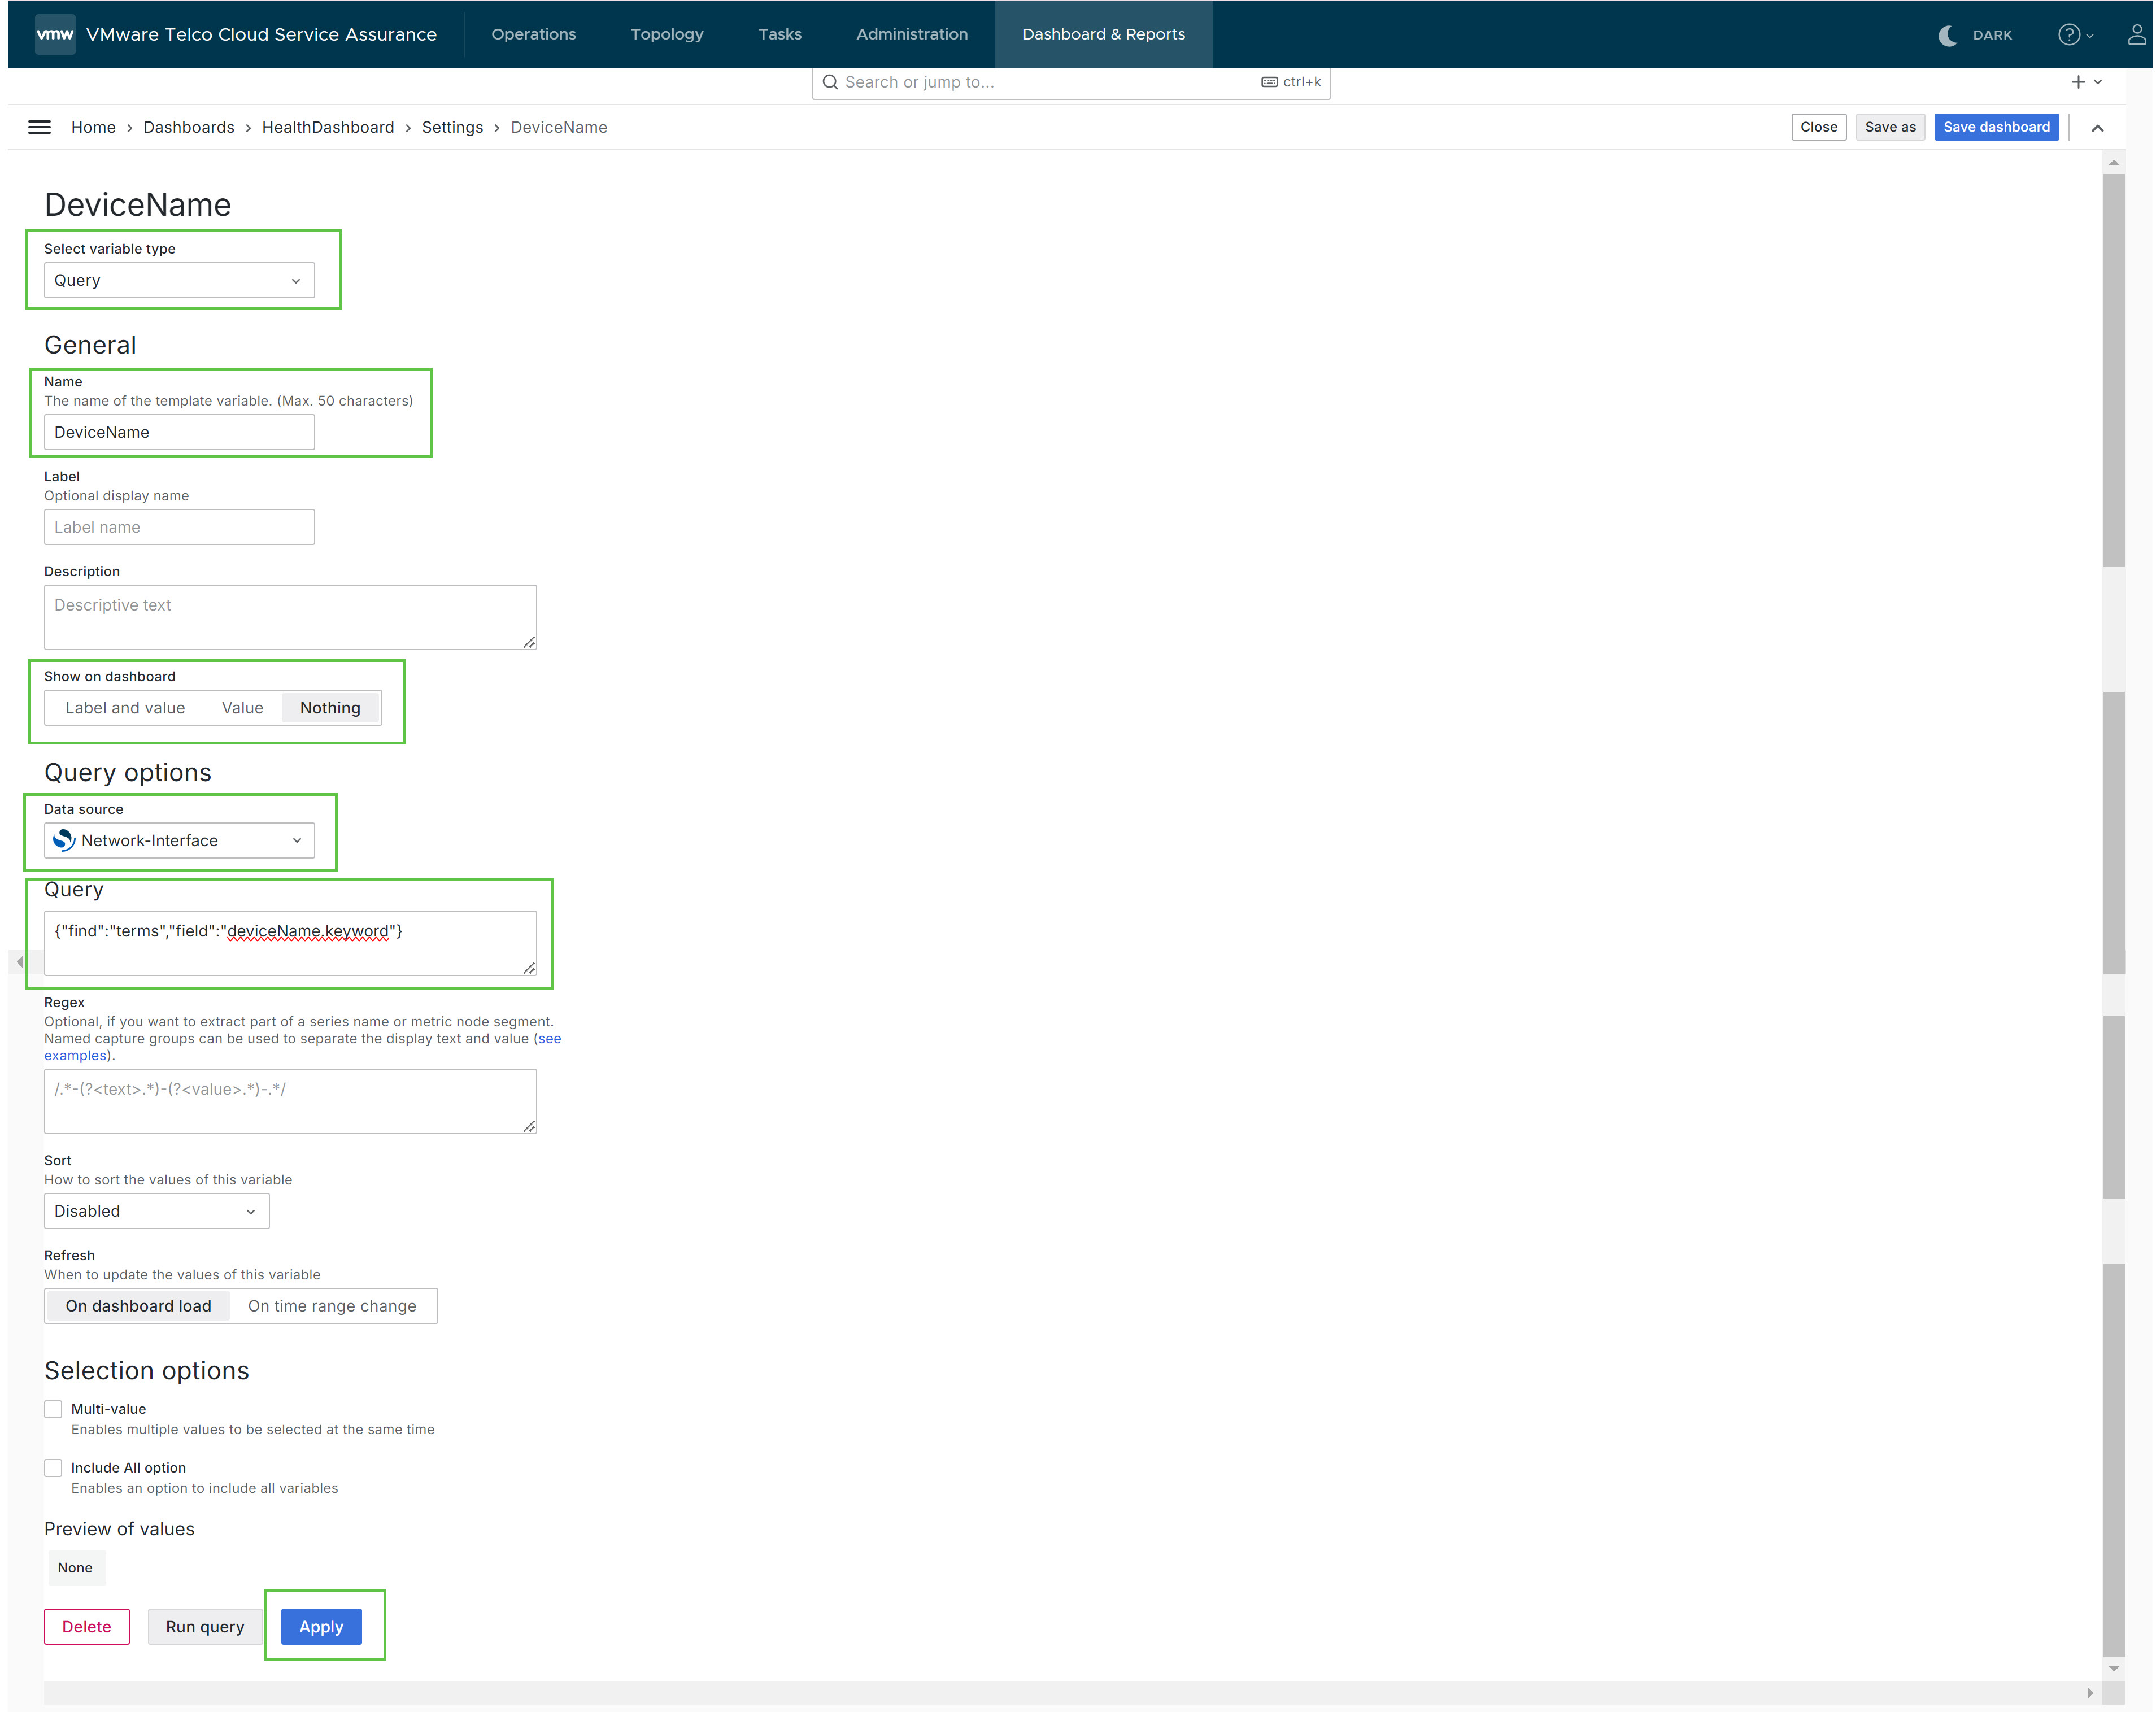
- In the Name field, under the General section, type DeviceName.
- In the Show on Dashboard field, under the General section, select Nothing.
- In the Data Source drop-down menu, under the Query Options section, select Network-Interface.
- In the Query field, under the Query Options section, type the query. For example, {"find":"terms","field":"deviceName.keyword"}.
- Click Apply.
- Click + New Variable.
- From the Select Variable Type drop-down menu, select Query.
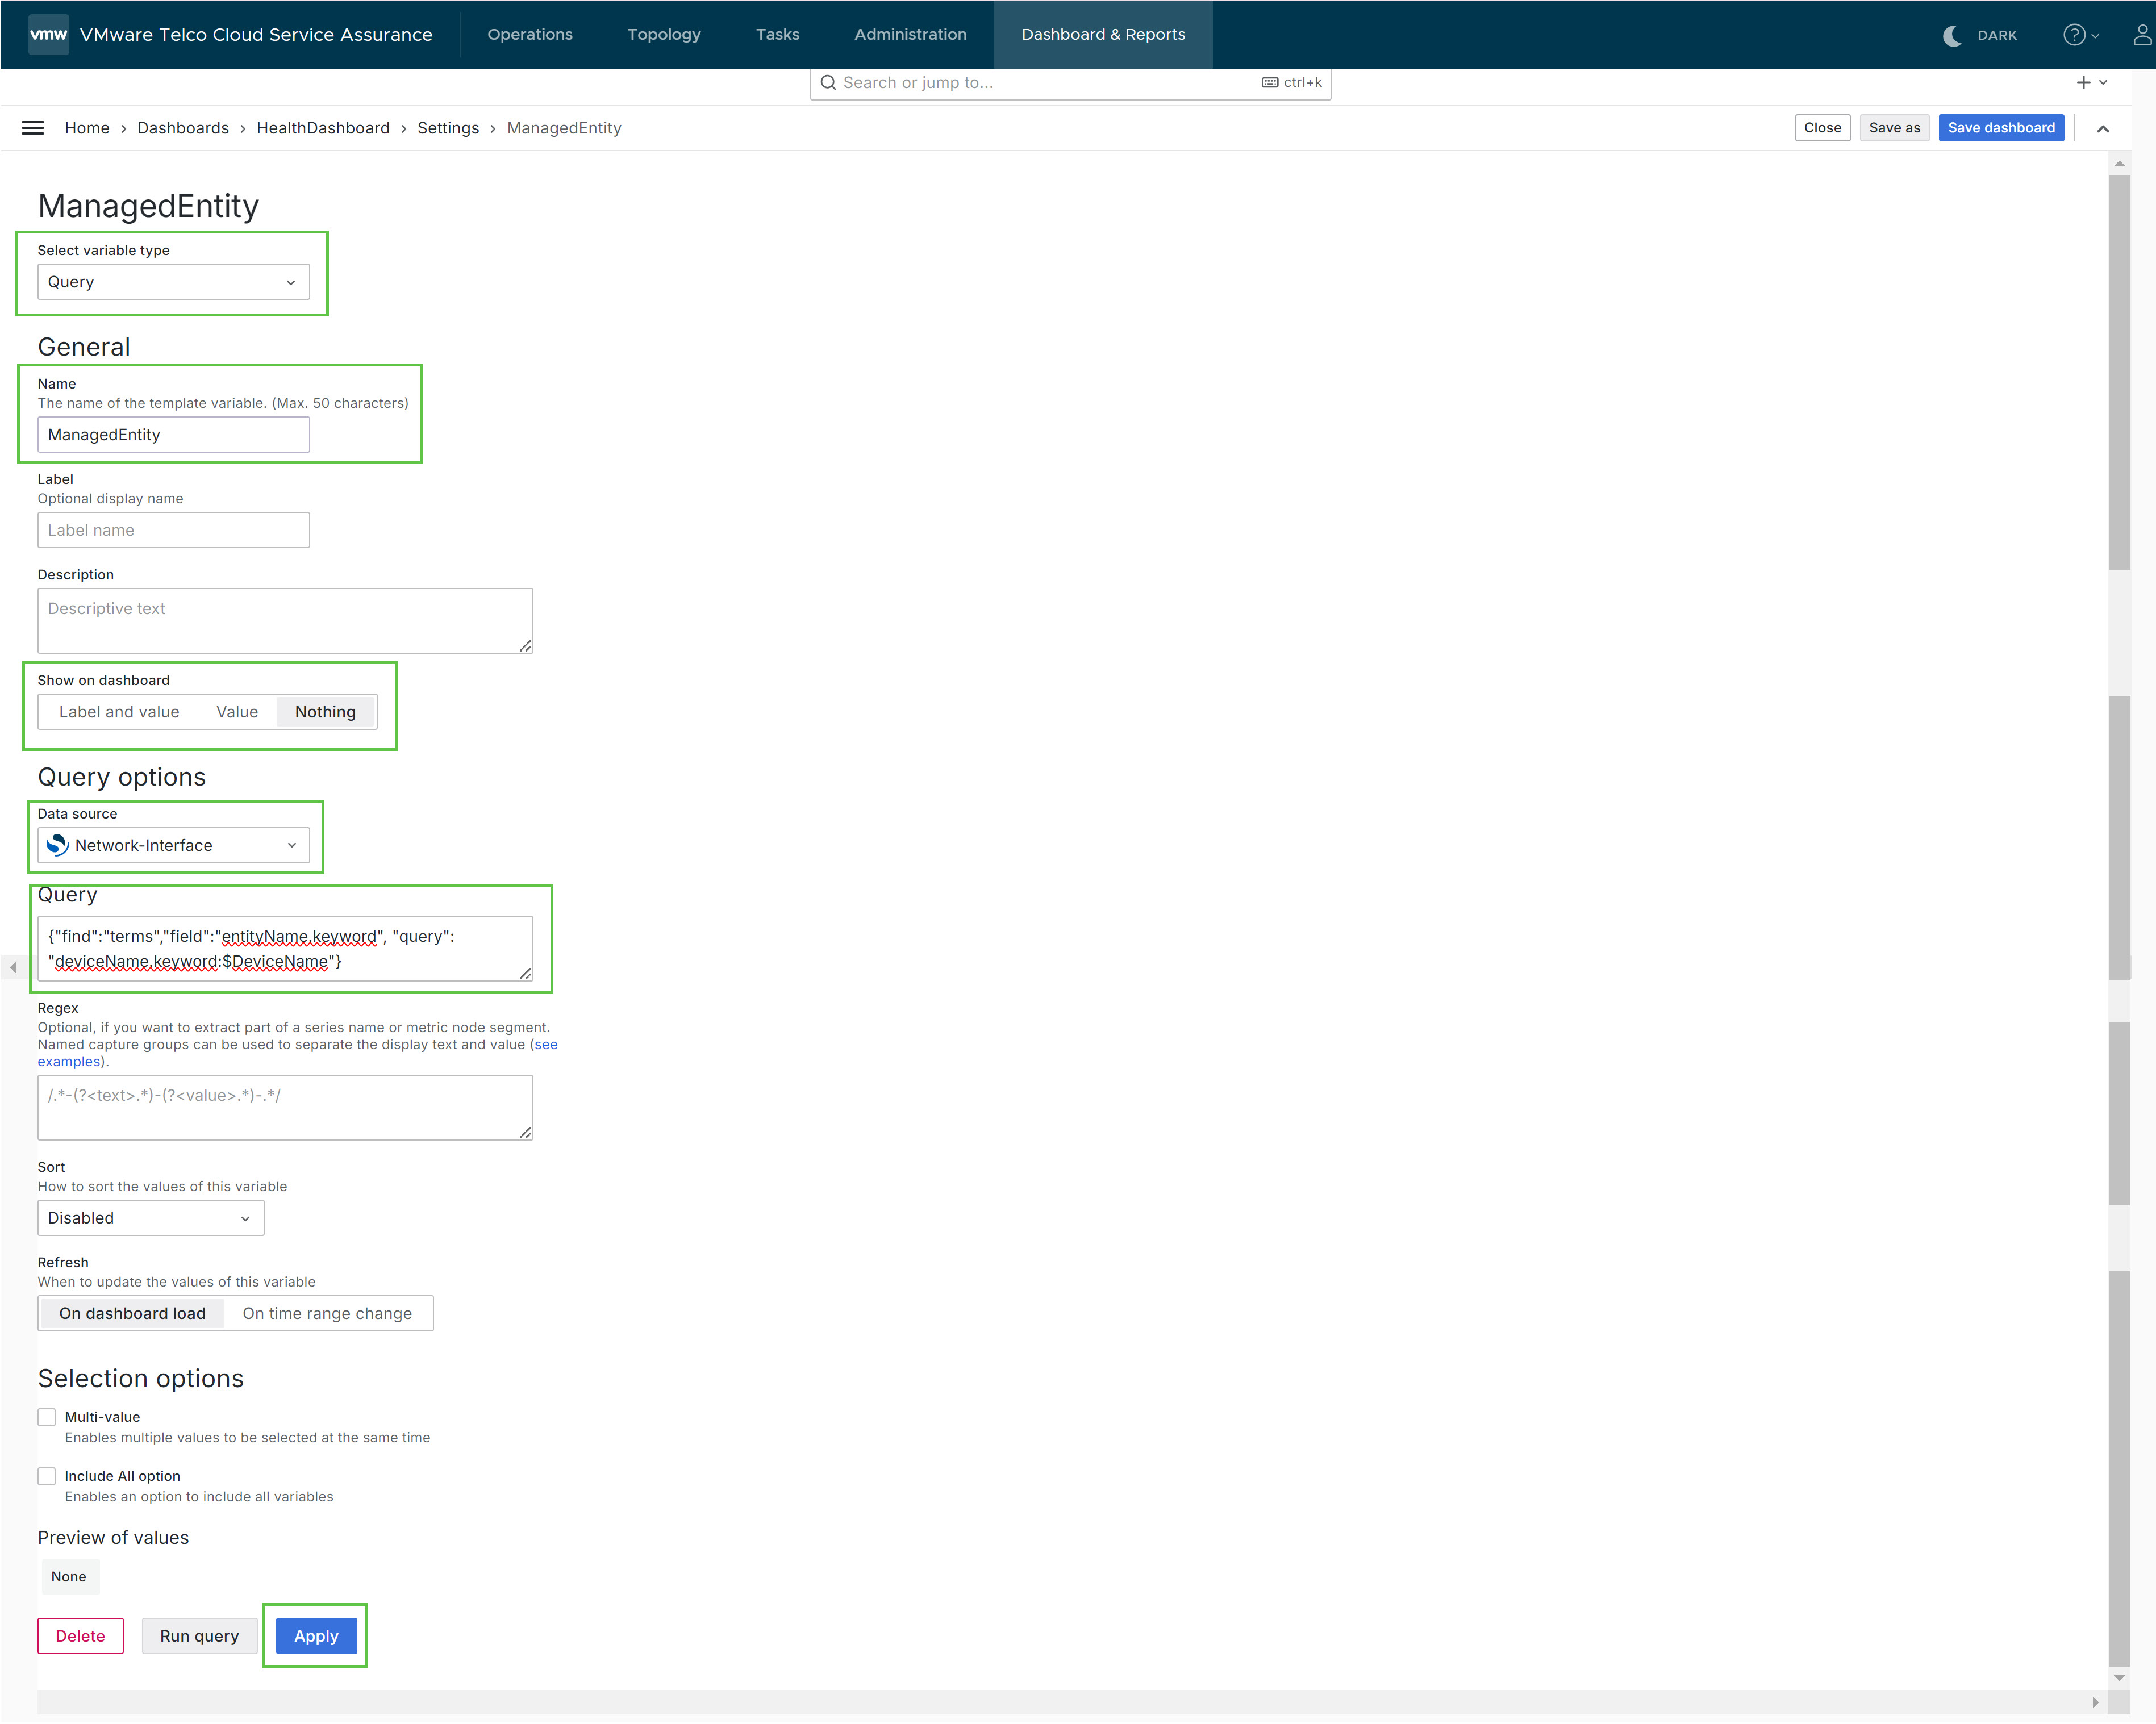
- In the Name field, under the General section, type ManagedEntity.
- In the Show on Dashboard field, under the General section, select Nothing.
- In the Data Source drop-down menu, under the Query Options section, select Network-Interface.
- In the Query field, under the Query Options section, type the query. For example, {"find":"terms","field":"entityName.keyword", "query": "deviceName.keyword:$DeviceName"}.
- Click Apply.
- Click Save Dashboard.
The Save Dashboard dialog window appears.
- Click Save, to save the variables to the dashboard.
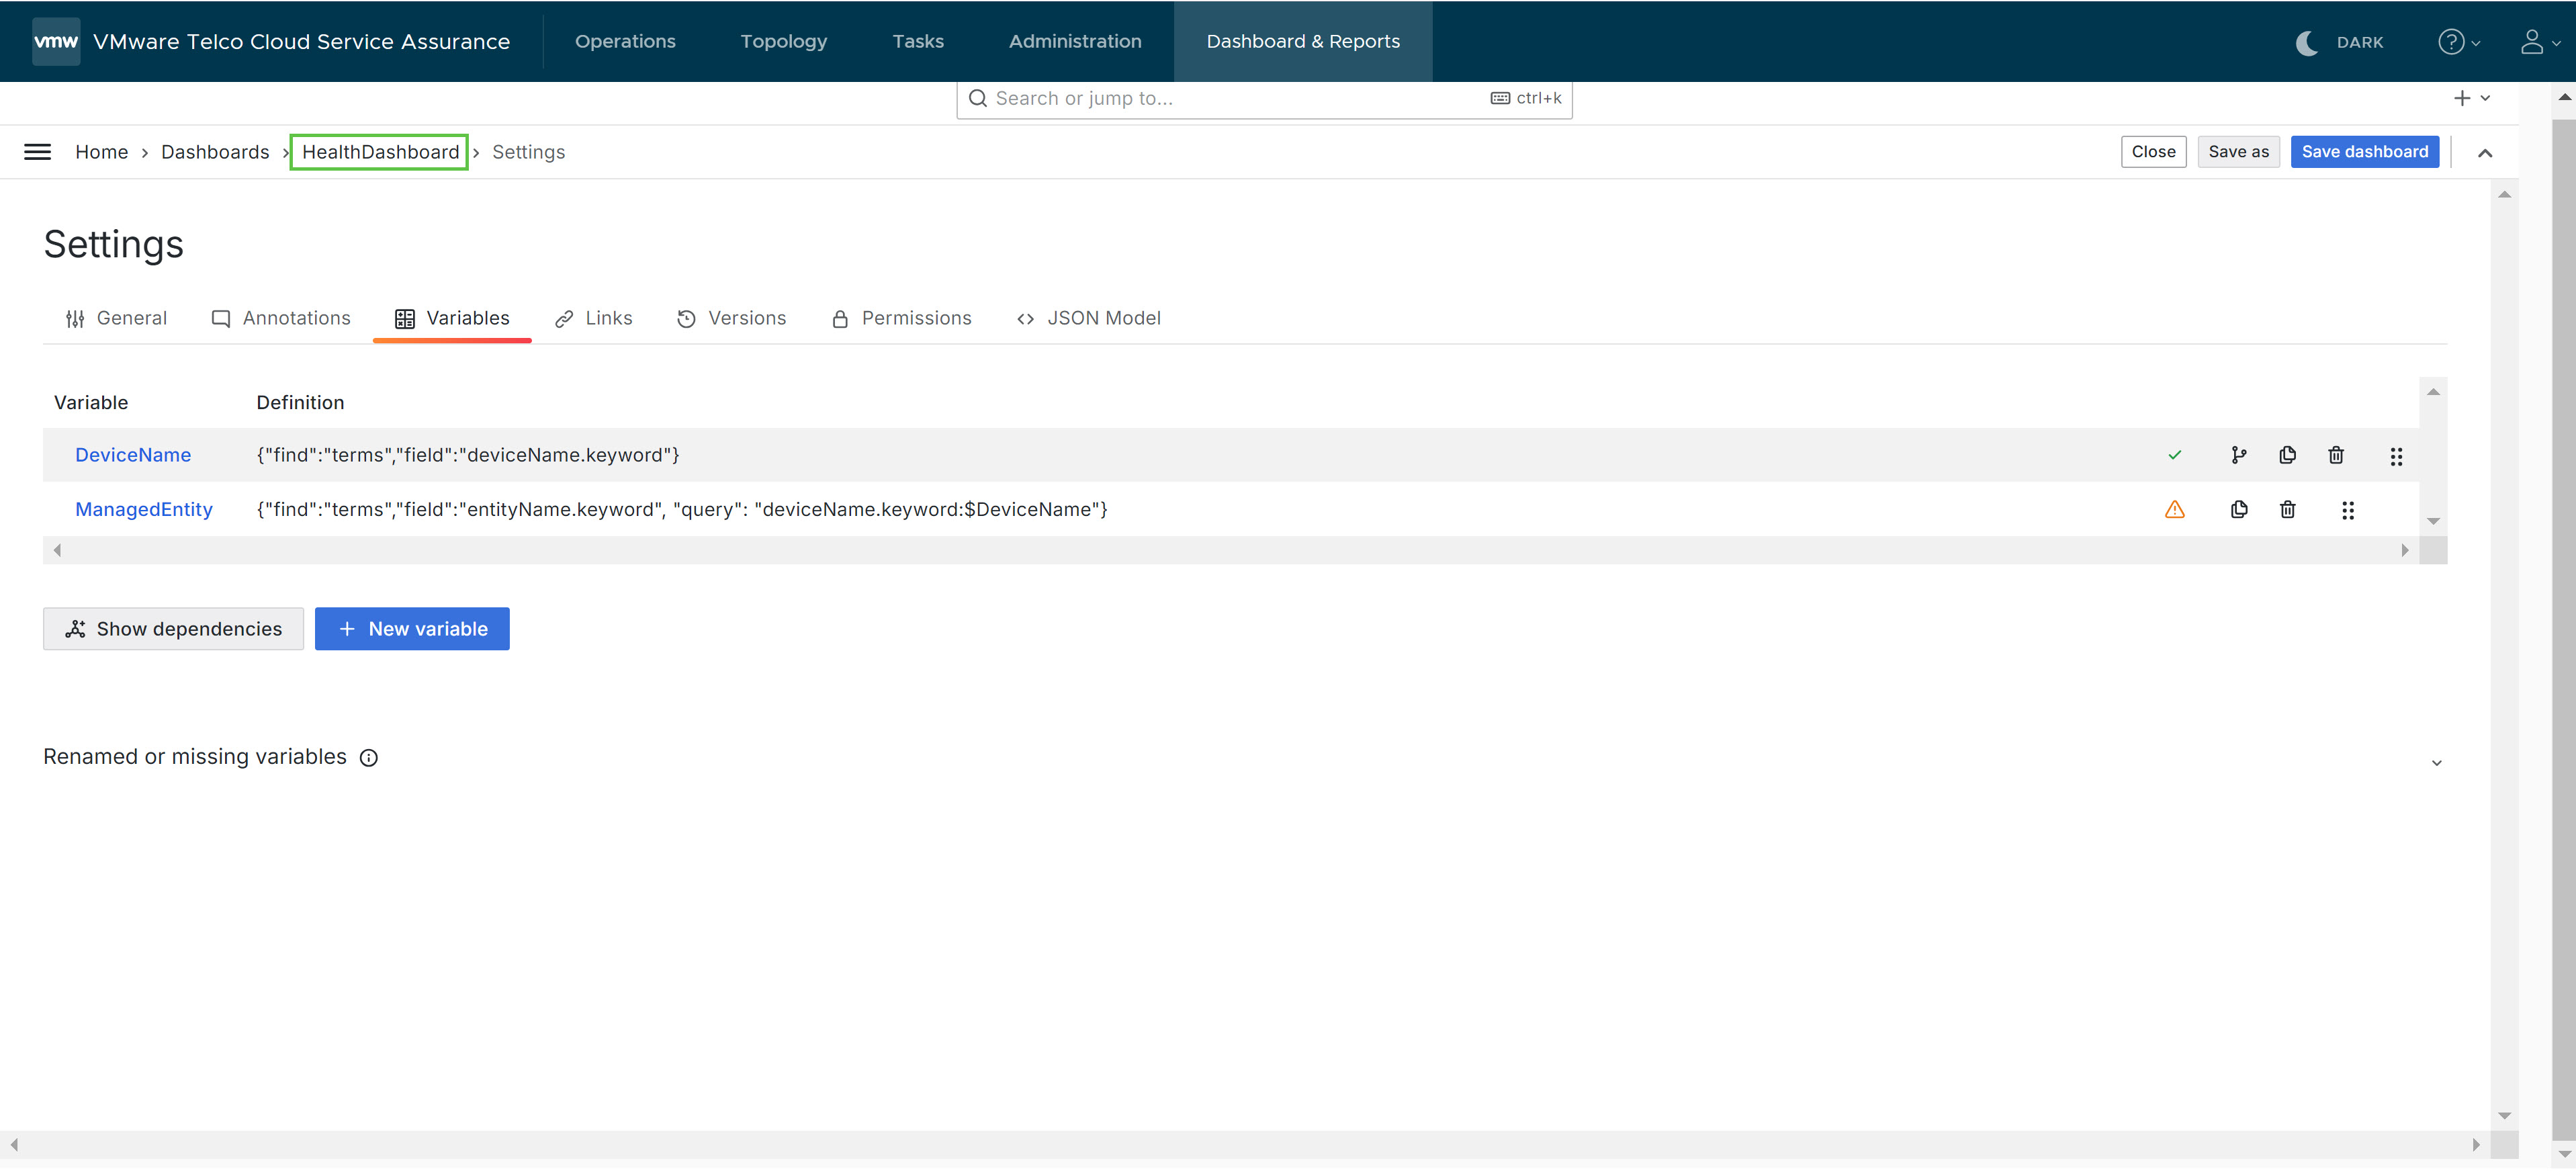
- Click the dashboard name on the breadcrumbs to go to the dashboard in which the variables are saved.
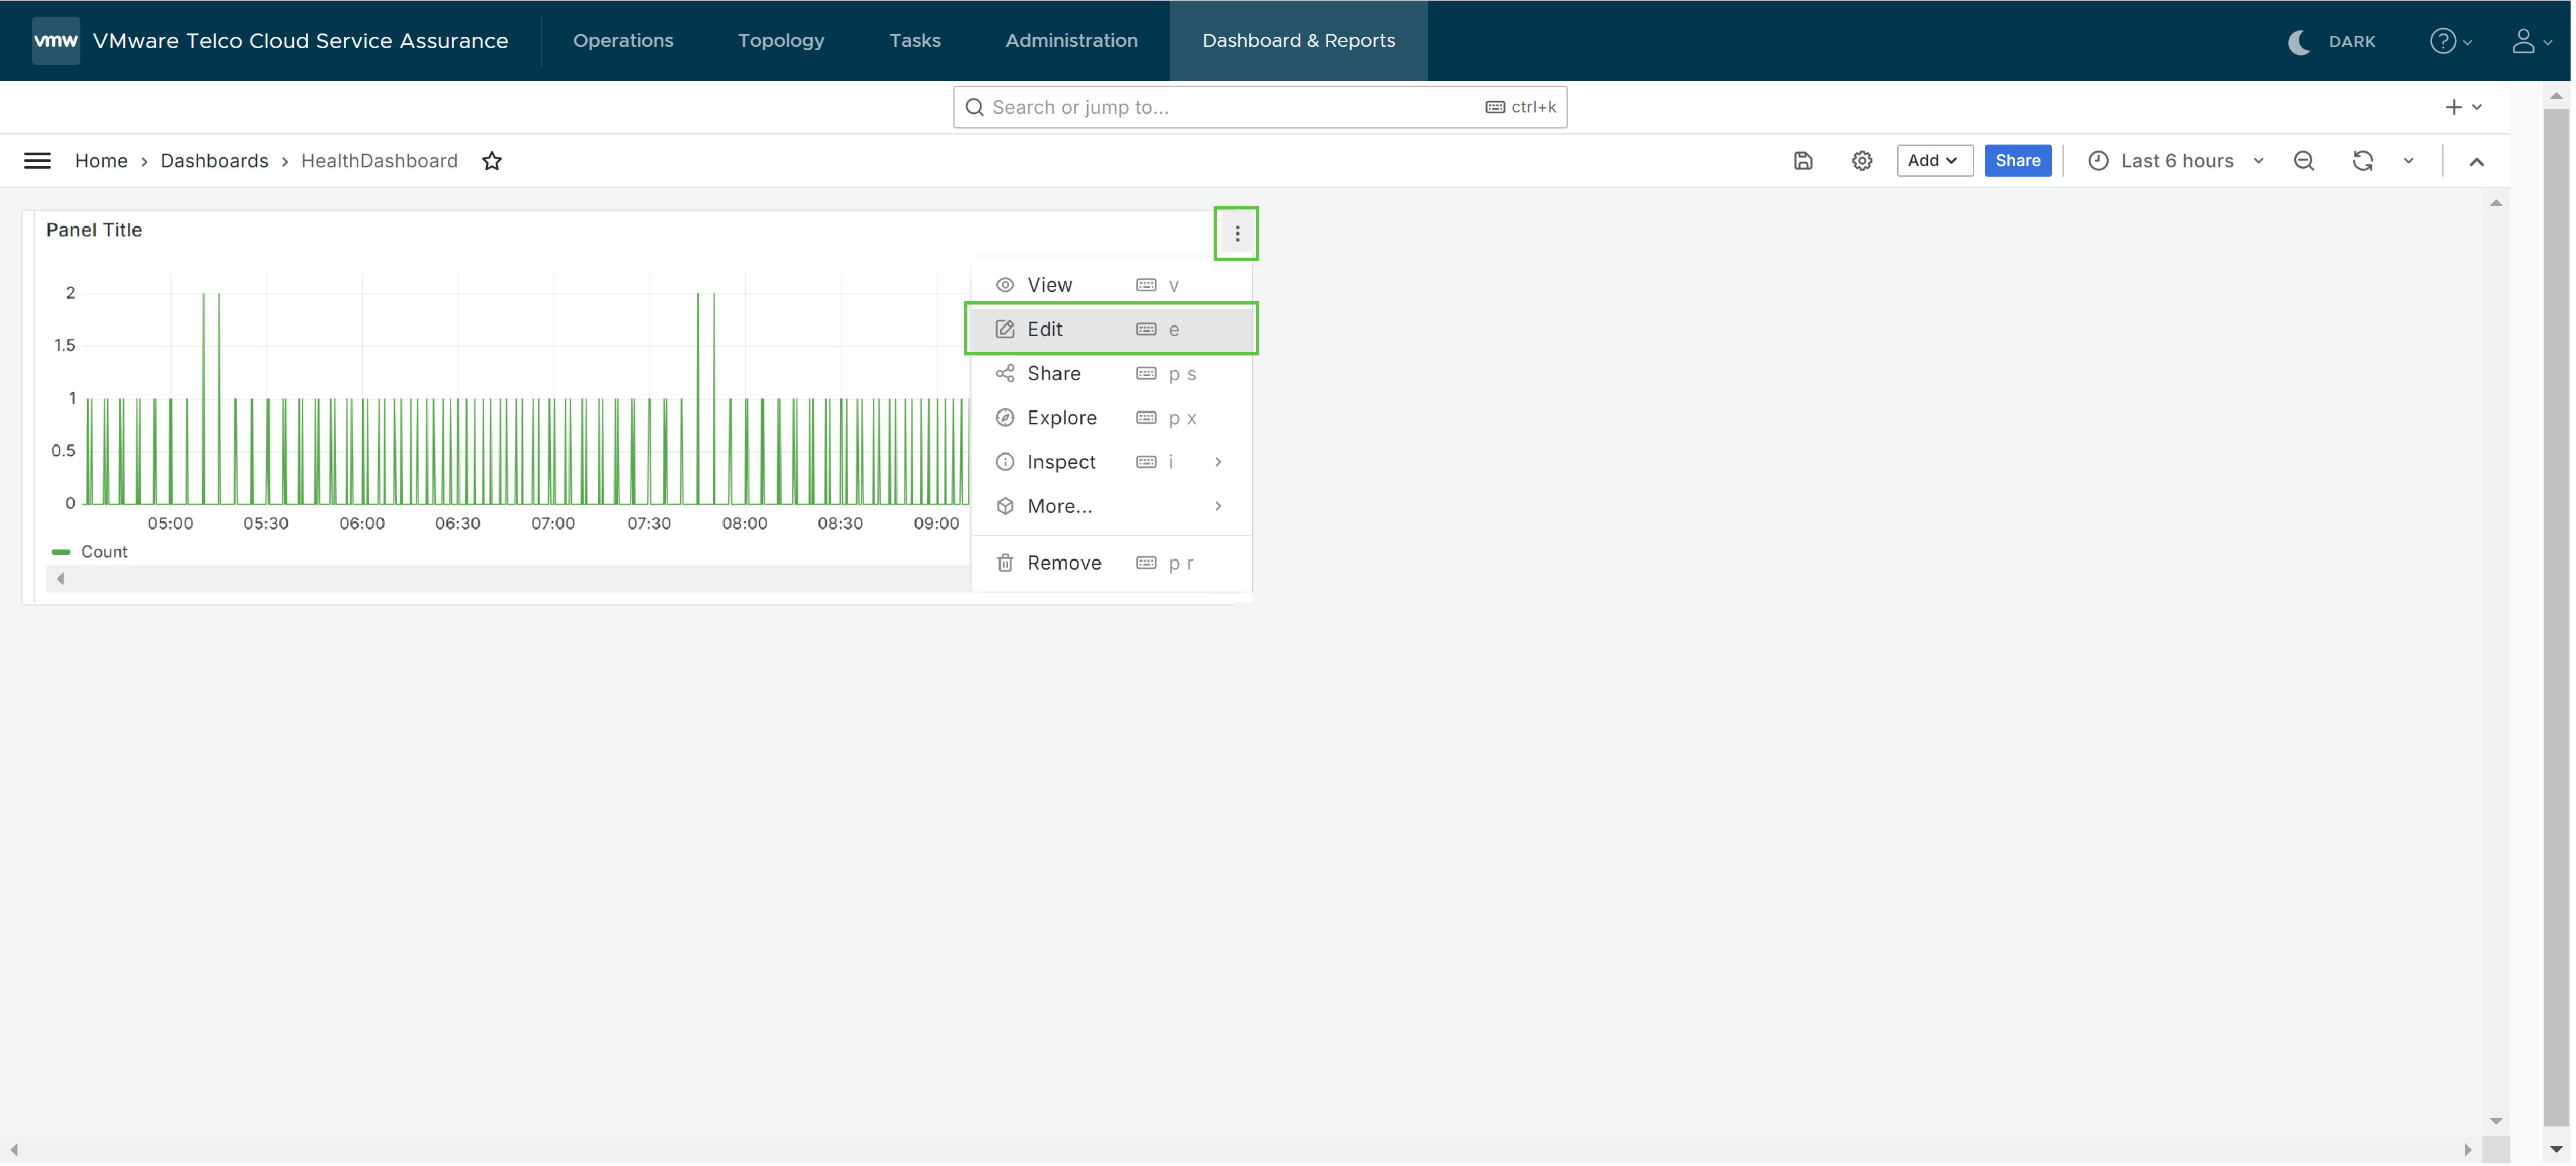
- Hover the mouse pointer over the Panel Title section, click the ellipse icon and then click Edit.
- Add the query in the Query field. For example, deviceName.keyword:$DeviceName AND deviceName.keyword:$ManagedEntity.
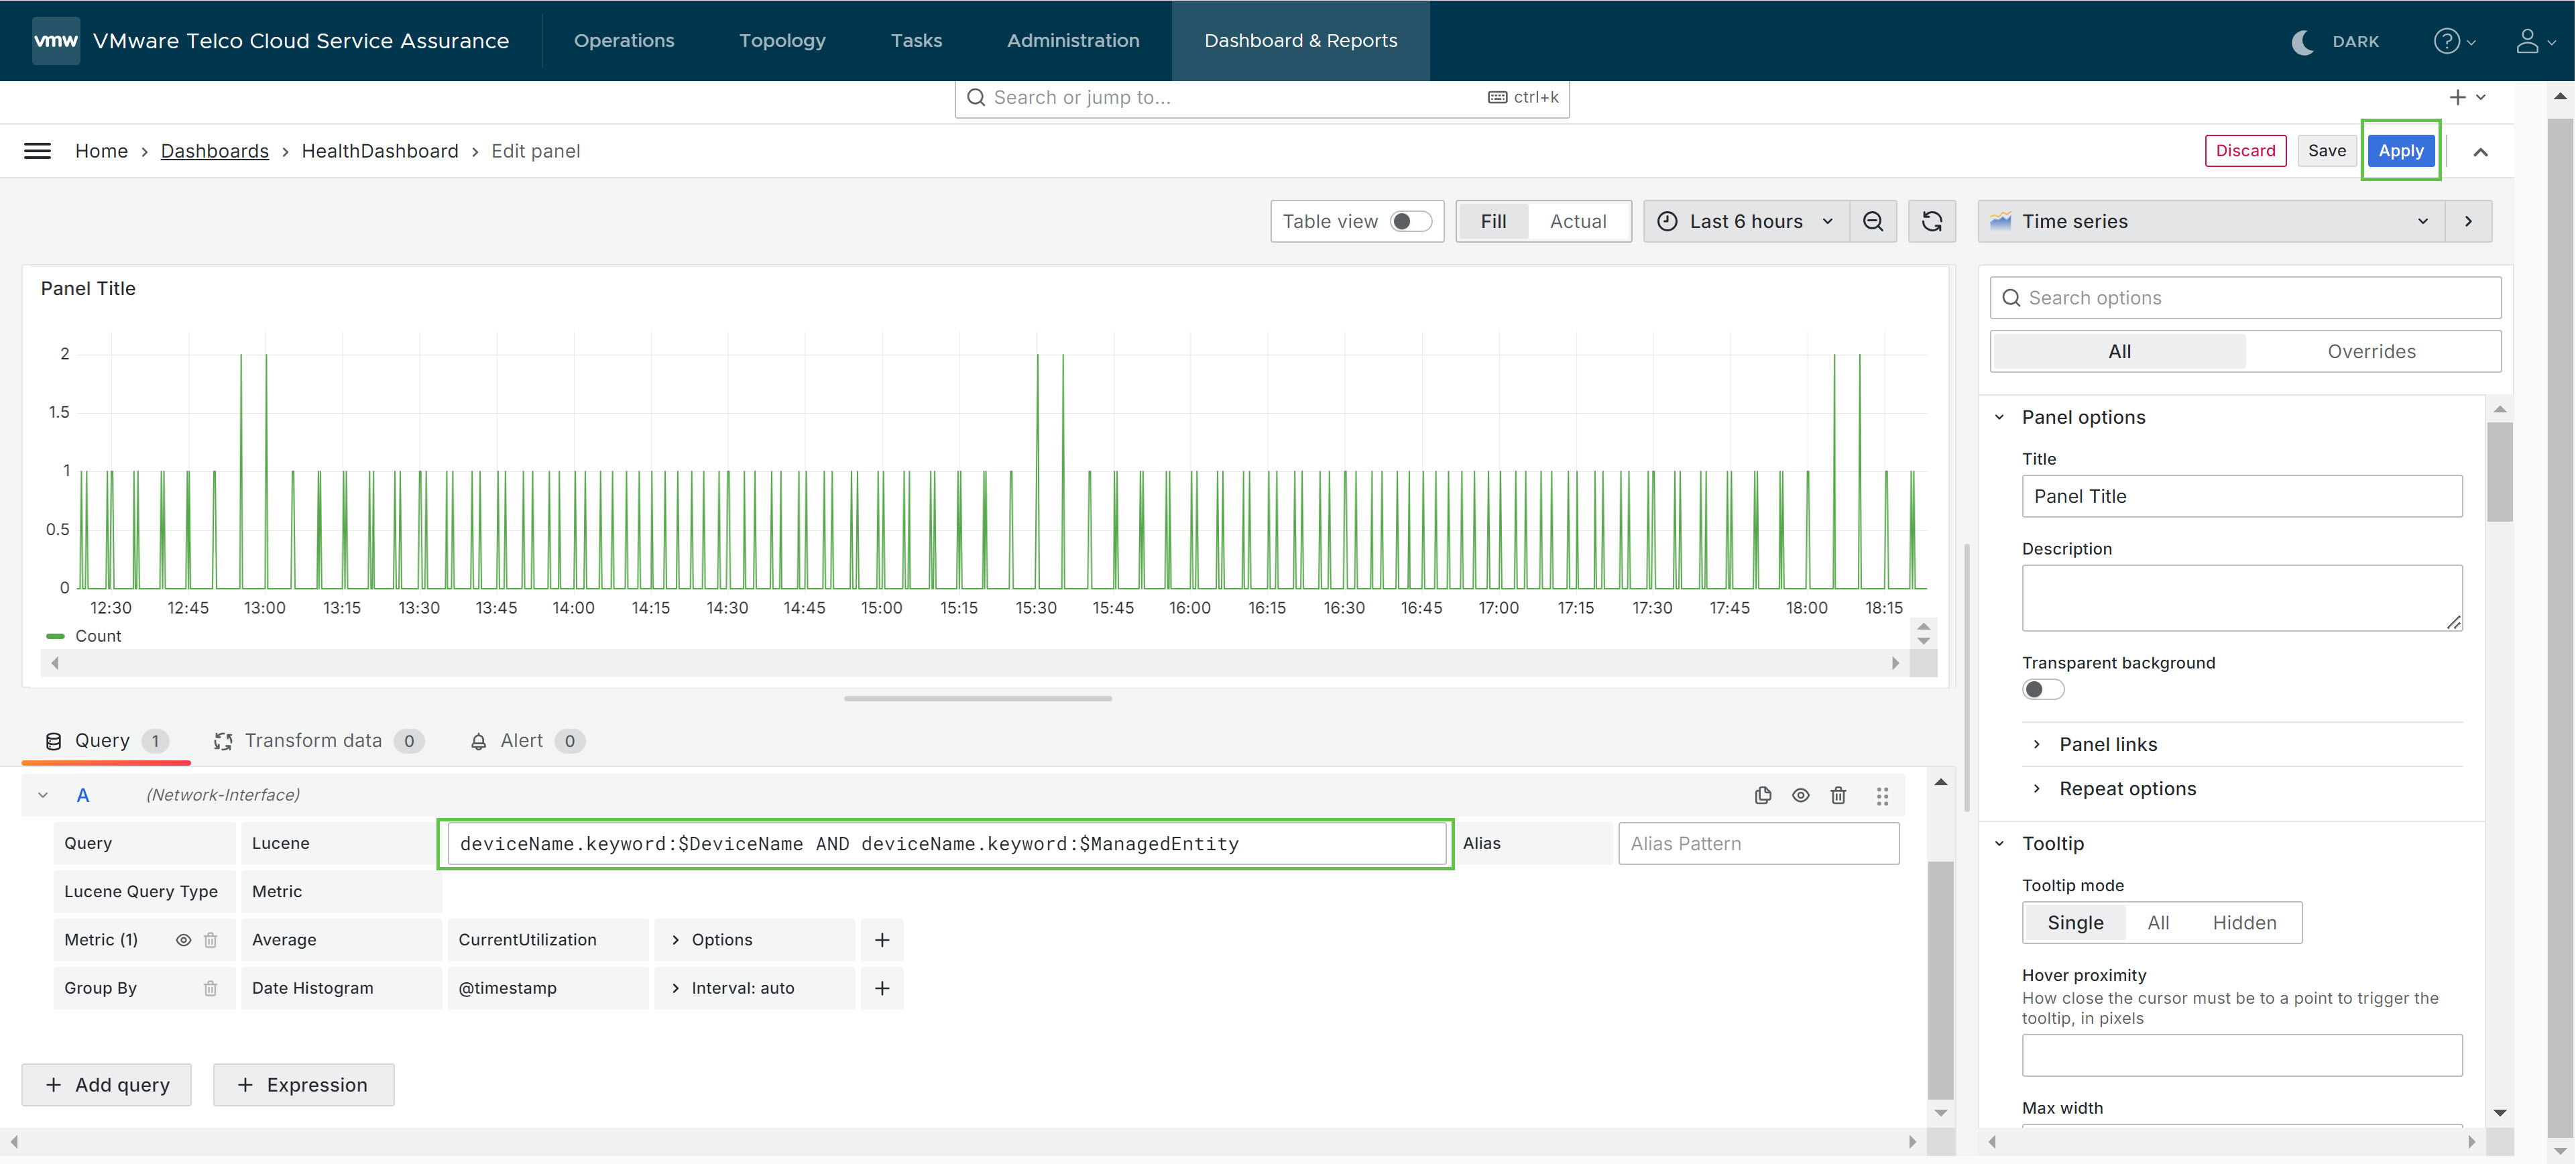
- Click Apply to apply the variables to the health dashboard.
- Map the dashboard for a given class type. For more information, see Map Health Dashboard.