Workspace ONE UEM powered by AirWatch lets you view and manage products to provision from the Products Dashboard. Navigate to .
The dashboard provides an easy method of viewing the status of your products and the devices they provision. The charts of information allow you to examine specific products or devices so you can remain informed about your device fleet.
Recent Product Status
This chart displays the 10 most recently created products and the status for each product. You can select any section of the bar graph to view the devices to which that product status applies.
- Compliant – The product installed on the device and the inventory data of the product reported by the device matches the requirements of the product.
- For Windows Rugged Only: The product also passes a file hash validation, ensuring the product on the device is the exact same product provisioned by the console or API call.
- In Progress – The product is sent to the device and is pending a compliance check based on inventory.
-
- For Windows Rugged Only: The compliance check also factors in file hash data received from the device.
- Must Push – The product deployment type sets to elective. The admin on the console side must initiate product installation.
- Dependent – The product depends on another product installation before installing onto devices.
- Failed – The product reached maximum attempts to install on the device and is no longer attempting to install.
Filters
You can filter the Recent Product Status chart to refer to specific device platforms that support product provisioning. To filter your results, select the Menu icon ( ) in the top right corner. Select the platforms you want to filter by.
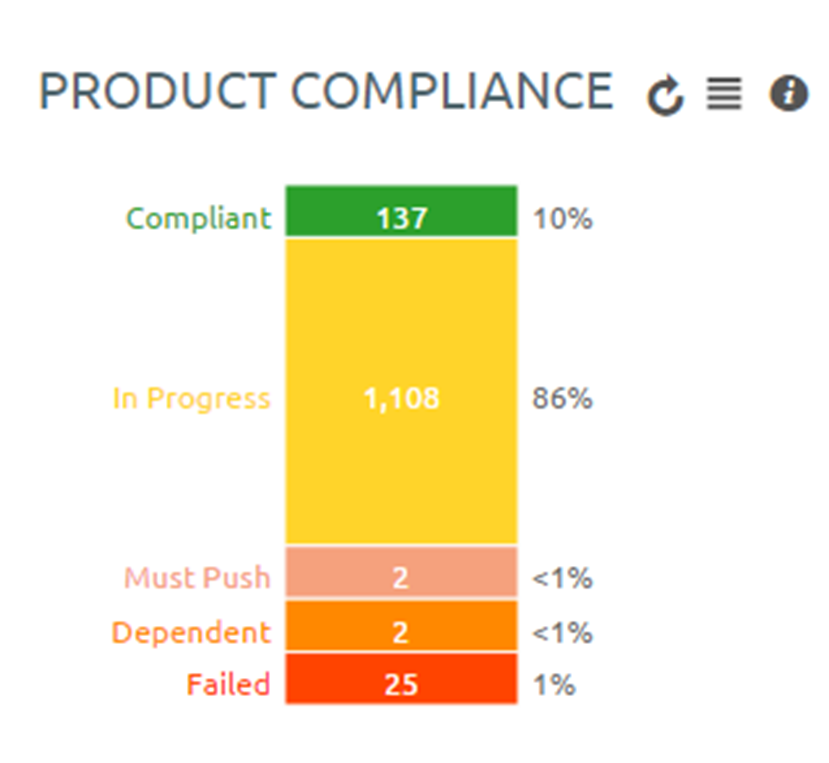
Product Compliance
The Product Compliance chart shows the total percentage of each compliance status. The number displayed in each status is the total number of product statuses reported from each device.
Filters
You can filter the Product Compliance chart to display specific device platforms that support product provisioning and the total percentage of each compliance status for a specific products.
To filter your results, select the Menu icon () in the top right corner. Select either the platform or the product by which you want to filter.
Top Job Compliance
This chart displays a ratio of total job count to the number of devices to which the product provisions. This ratio gives you information on what products are having issues running.
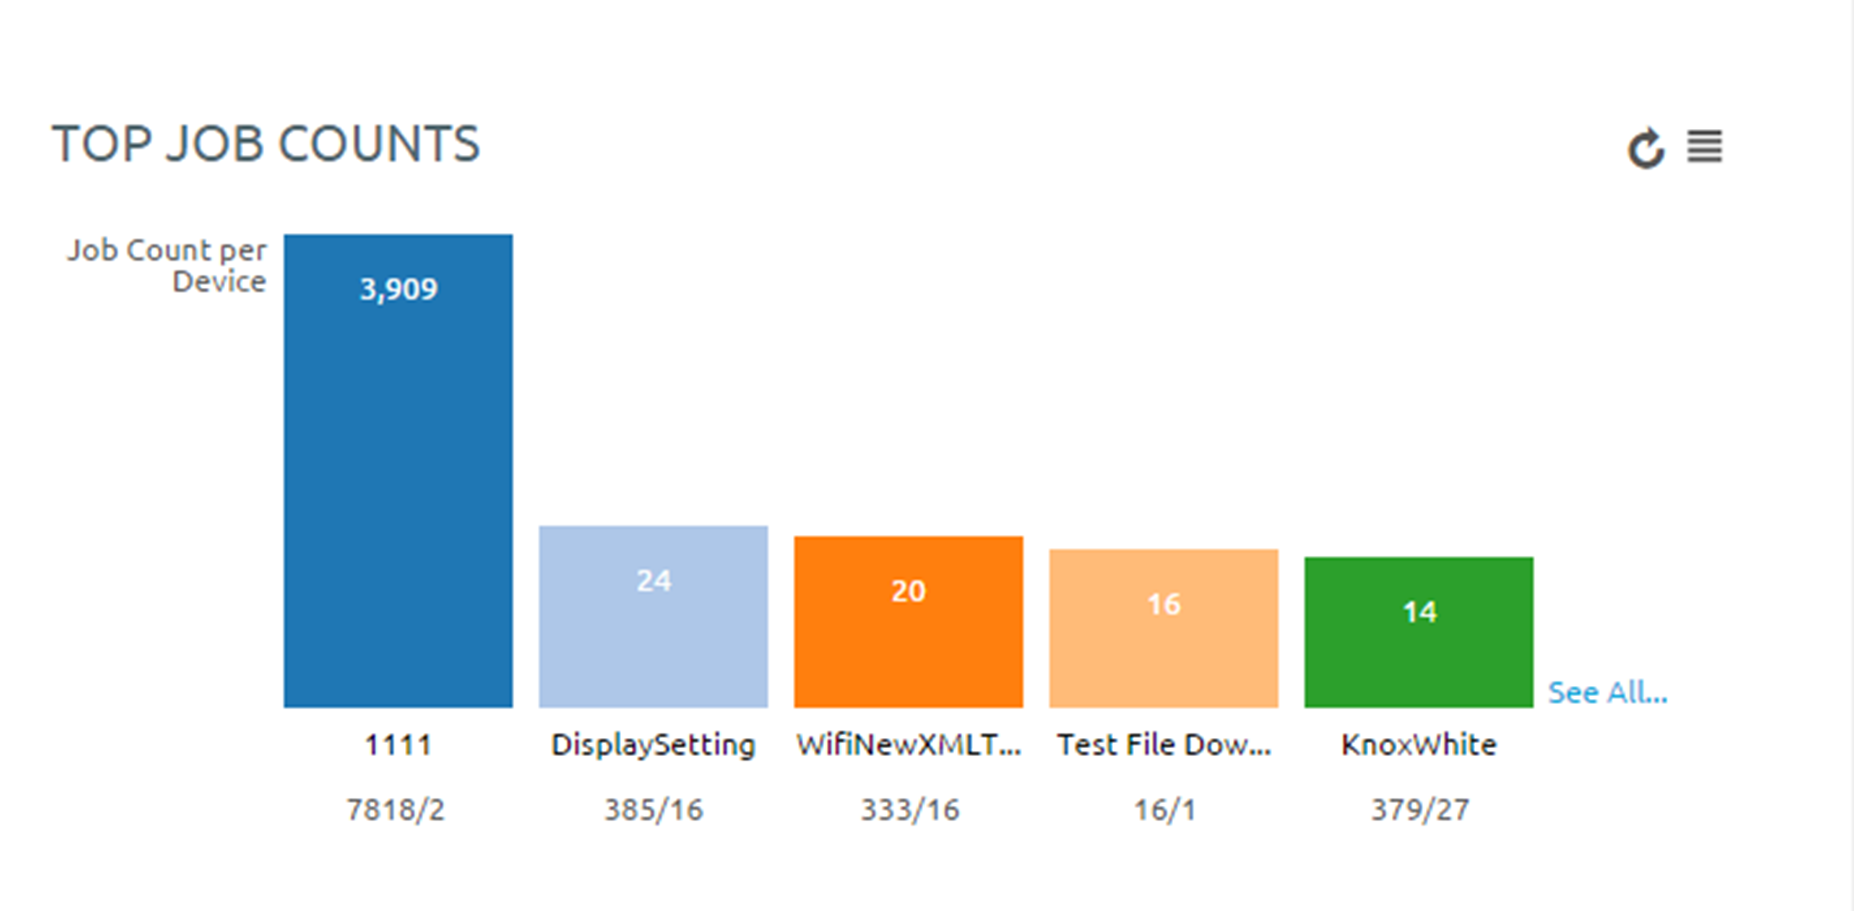
For example, if the number shown is a three, then you know that an average of three jobs per device happens for this product. If you select the bar for each product, the View Devices screen displays with all devices currently assigned the product. You can then determine which jobs are failing and the reason for those failures.
Filters
You can filter the Total Job Compliance chart to refer to specific device platforms that support product provisioning. To filter your results, select the menu icon () in the top right corner. Select the platforms you want to filter by.
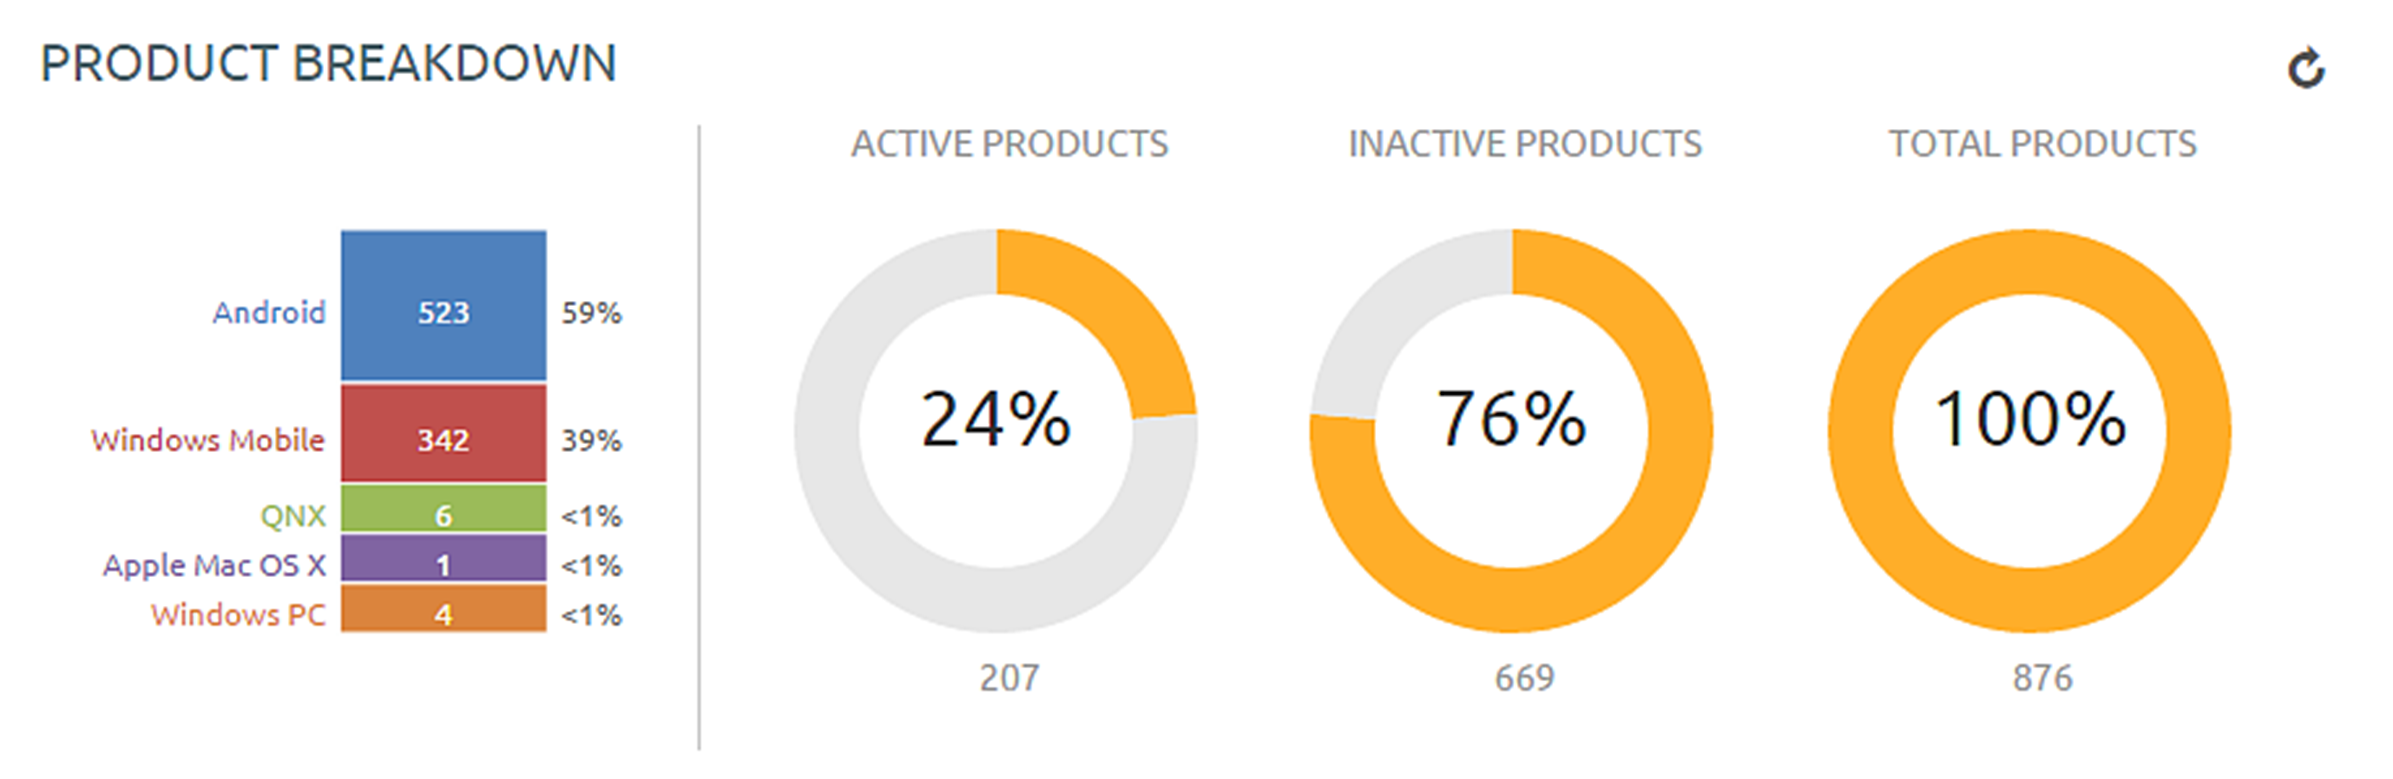
Product Breakdown
This section shows you the breakdown of your products. The first chart shows the breakdown of products by platform. Selecting a platform displays the Products List View filtered by that product. This arrangement allows you to see the products available for each platform quickly.
The second chart displays the percentage of your products that are active vs. inactive and a total number of products. Selecting a chart displays the Products List View page filtered by the status of the product.