VMware vRealize Log Insight is used to collect log data from ESXi hosts, and to connect to vCenter Servers to collect server events, tasks, and alarm data. vRealize Log Insight integrates with vRealize Operations Manager to send notification events. Since vRealize Log Insight collects real-time unstructured data, all elements in the NFV environment can be configured to send it their log data. This log aggregation provides a single log collector for the NFV environment.
VMware vRealize Log Insight is deployed in the Management pod using a single cluster configuration, which consists of a minimum of three nodes leveraging the Log Insight Integrated Load Balancer (ILB). A single log message is only present in one location within the cluster at a time. The cluster remains up and available to ingest data and serve queries during any temporary unavailability of a single node.
Data is collected using the syslog protocol or an API. All NSX Manager syslog information, distributed firewall logs, and NSX Edge Services Gateway syslog information is sent to vRealize Log Insight. VMware Integrated OpenStack produces logs that are sent to vRealize Log Insight as well.
Additional VMware Integrated OpenStack troubleshooting and API access logs are stored locally. These logs can be forwarded by creating an additional logger that can send diagnostics logs to vRealize Log Insight.
VMware vRealize Log Insight Archiving
Archiving is primarily a long term retention tool. The process copies raw data to an external NFS storage location. Archives are much smaller than indexes, but require indexing if they are loaded back into the vRealize Log Insight system. For additional information about vRealize Log Insight archiving, see the VMware vRealize Log Insight documentation.
VMware vRealize Log Insight Content Pack
vRealize Log Insight gathers log events from multiple sources, and through special content packs delivers solution specific dashboards to perform log analytics, using redefined alerts. For additional information about vRealize Log Insight solutions, see the VMware Solution Exchange marketplace.
VMware vRealize Log Insight Content Pack for OpenStack
OpenStack is very log intensive and trying to troubleshoot across the layers will be very difficult without central logging. More importantly, Log Insight provides an interactive logging environment where administrators can perform realtime queries on OpenStack values. A special Log Insight OpenStack management pack is provided for free download through the VMware vCloud Management Marketplace.
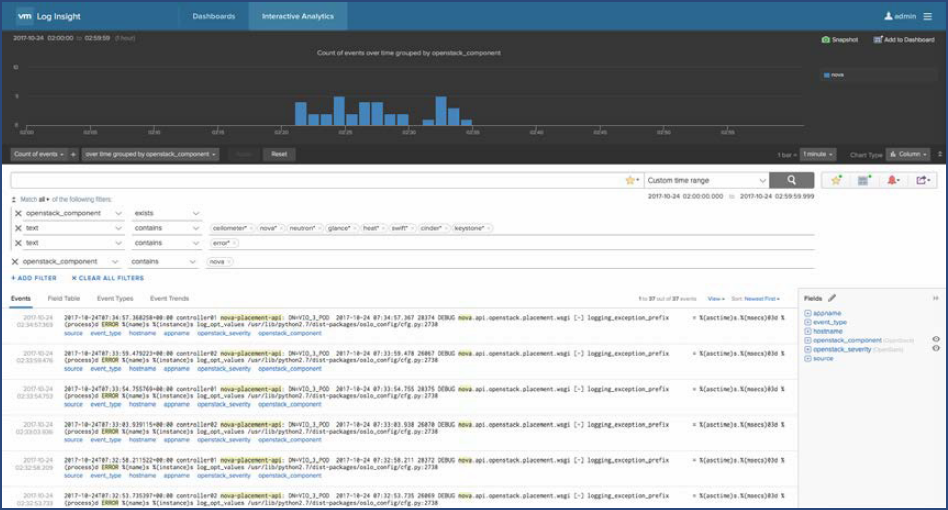
The OpenStack content pack provides pre-configured dashboards that provide quick insight into the logs across the infrastructure. An overview of the events in the OpenStack environment is provided. This dashboard allows the administrator to view a list of events grouped by component and severity. When there are OpenStack events that need to be reviewed quickly, interactive analytics provides the capability to dive deeper into specific events by applying filters that allow for realtime queries.
The VMware vRealize Log Insight OpenStack content pack provides several dashboards, such as:
- An overview section where events are group by components and severity over time
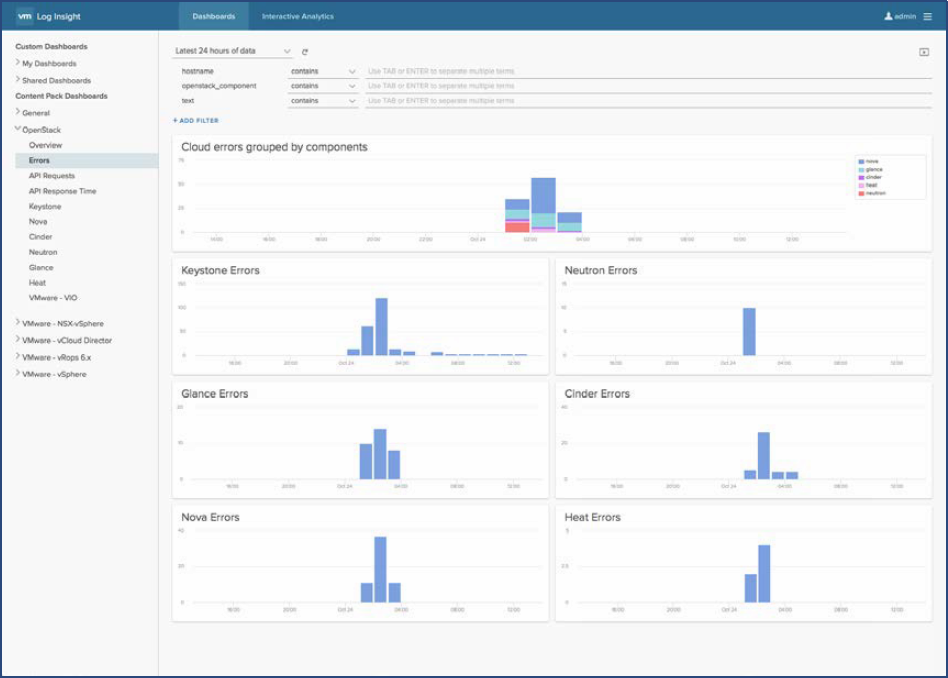
- An Errors dashboard that provides errors grouped by components and errors per OpenStack component.
- An API requests dashboard that groups API requests in different ways, such as by user id, tenant id, hostname, status code to name a few.
- An API response Time dashboard which can be used to review the response times from Nova, Neutron, Cinder, Glance, Keystone and Heat.
- Individual dashboards for each of the individual OpenStack components.
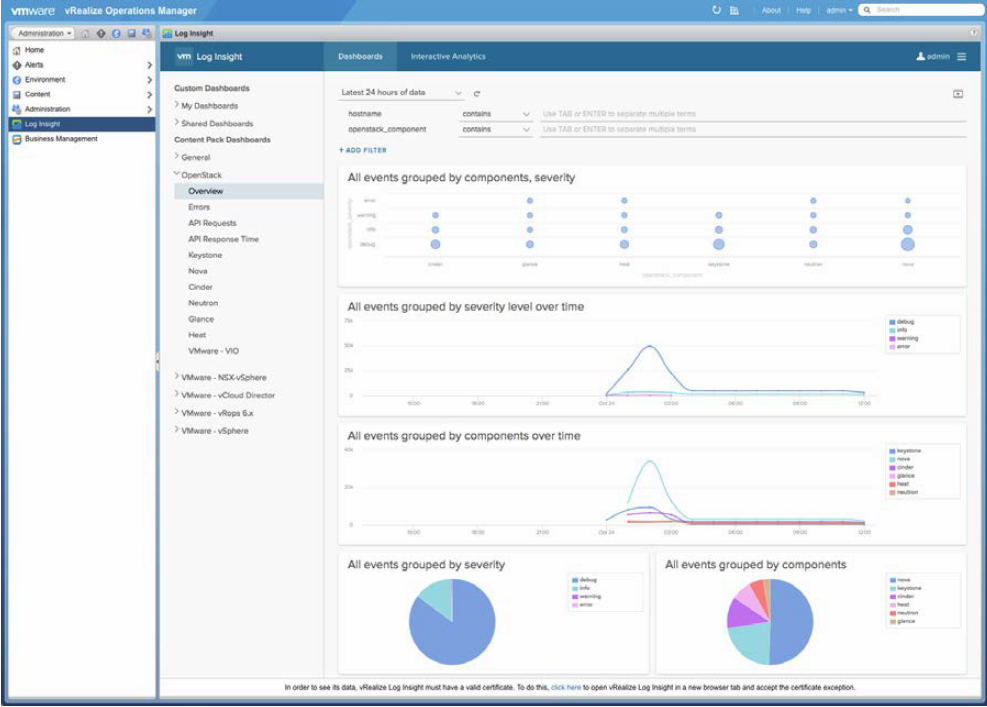
The figure that follows provides an example output from the OpenStack overview dashboard. In this one dashboard, a complete overview of all the OpenStack components are provided, grouped by severity. A trend line is provided for different types of events over time grouped by severity. vRealize Log Insight OpenStack Overview Dashboard
The next figure provides an example output of the Errors dashboard. This single dashboard provides an overview of all of the errors grouped by components and with the Interactive Analytics capabilities of vRealize Log Insight, with just a click of a button, an administrator can zoom directly into any error for more information. In this example output, Nova seems to have quite a few errors.