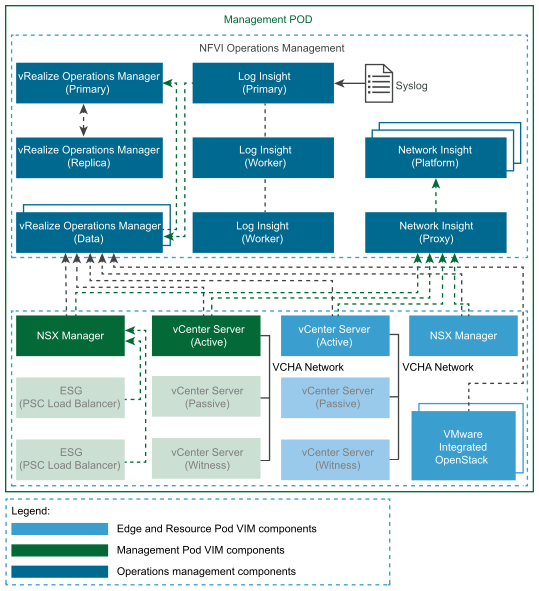
Management of the NFV environment is driven by the three tools: vRealize Operations Manager, vRealize Log Insight, and vRealize Network Insight. The network operations center (NOC) primarily interacts with vRealize Operations Manager as a single pane of glass, while using the other tools for issue isolation, remediation, and planning.
The vRealize Operations user interface can be configured in various ways, however the main pane informs the NOC personnel about three categories:
- Health. The current health of the system is displayed in this tab. Red alerts in this tab indicate that an immediate issue is taking place.
- Risk. Future issues, based on deep machine learning and analytics, are displayed in this tab. Risks indicate future performance or capacity problems and can become health issues. Proactively resolving risks is the best approach to maintaining high quality services.
- Efficiency. This area indicates optimization opportunities based on the way the platform is used. If the operator follows these recommendations, NFVI resources used in a wasteful way, or suboptimally configured, can be recovered and the platform efficiency will increase.
The NFVI operator first focuses on maintaining the healthy state of the environment. When a vRealize Operations Manager Health Badge reports red, a critical issue is raised and an indication of the cause is provided. To resolve the issue the operator is presented with further detail in the vRealize Operations graphical user interface. These details are collected using vRealize Log Insight. The operator can correlate network information, using vRealize Network Insight to speed up issue resolution. In combination, these three tools ensure that all layers of the NFVI environment are monitored, and that issues are quickly isolated and remediated.
vRealize Operations Manager monitors performance and capacity by collecting information exposed by the devices it monitors. NFVI performance information, such as the number of hosts, virtual machines, physical cores, and vCPU used, are examples of the compute metrics monitored. vRealize Operations Manager also collects information about networking components, including interface utilization, packet drop rate, observed throughput, and storage information as read and write performance, usage rate, and total capacity. The performance and capacity data collected provide a holistic system view that can be used to manually address issues and perform capacity planning. Alternatively, Distributed Resource Scheduler (DRS) can be used to automatically balance VNF Components based on performance needs and capacity availability, eliminating resource contention that might otherwise occur.
In VMware vCloud NFV 2.0, future resource contention is evaluated based on continuous monitoring. Coupled with vRealize Operations Manager dynamic thresholds, which understand the behavior of VNFs throughout the day, calculations are run to create a band describing normal operations for each metric and object combination. The band includes an upper and lower boundary for each metric associated with an object, and is tailored specifically to the individual VNF Component, providing data about the amount of resources the component requires throughout the day. Together with an understanding of the size of the NFVI hosts, and their aggregated resources, the operator can predict where contention will occur and can balance the VNFs accordingly. Network utilization is one of the new data points added to the DRS considerations in VMware vCloud NFV 2.0, in addition to storage, CPU, and memory.
Network DRS is fundamental to the multitenancy characteristic of the platform as described. Using Network I/O Control (NIOC) it is possible to set a reservation for a VNF Component in terms of network bandwidth and have DRS consider the reservation in resource placement. This means that when network capacity planning is performed for tenants, the operator can rely on DRS to ensure that tenants are not consuming other tenants' network capacity.
