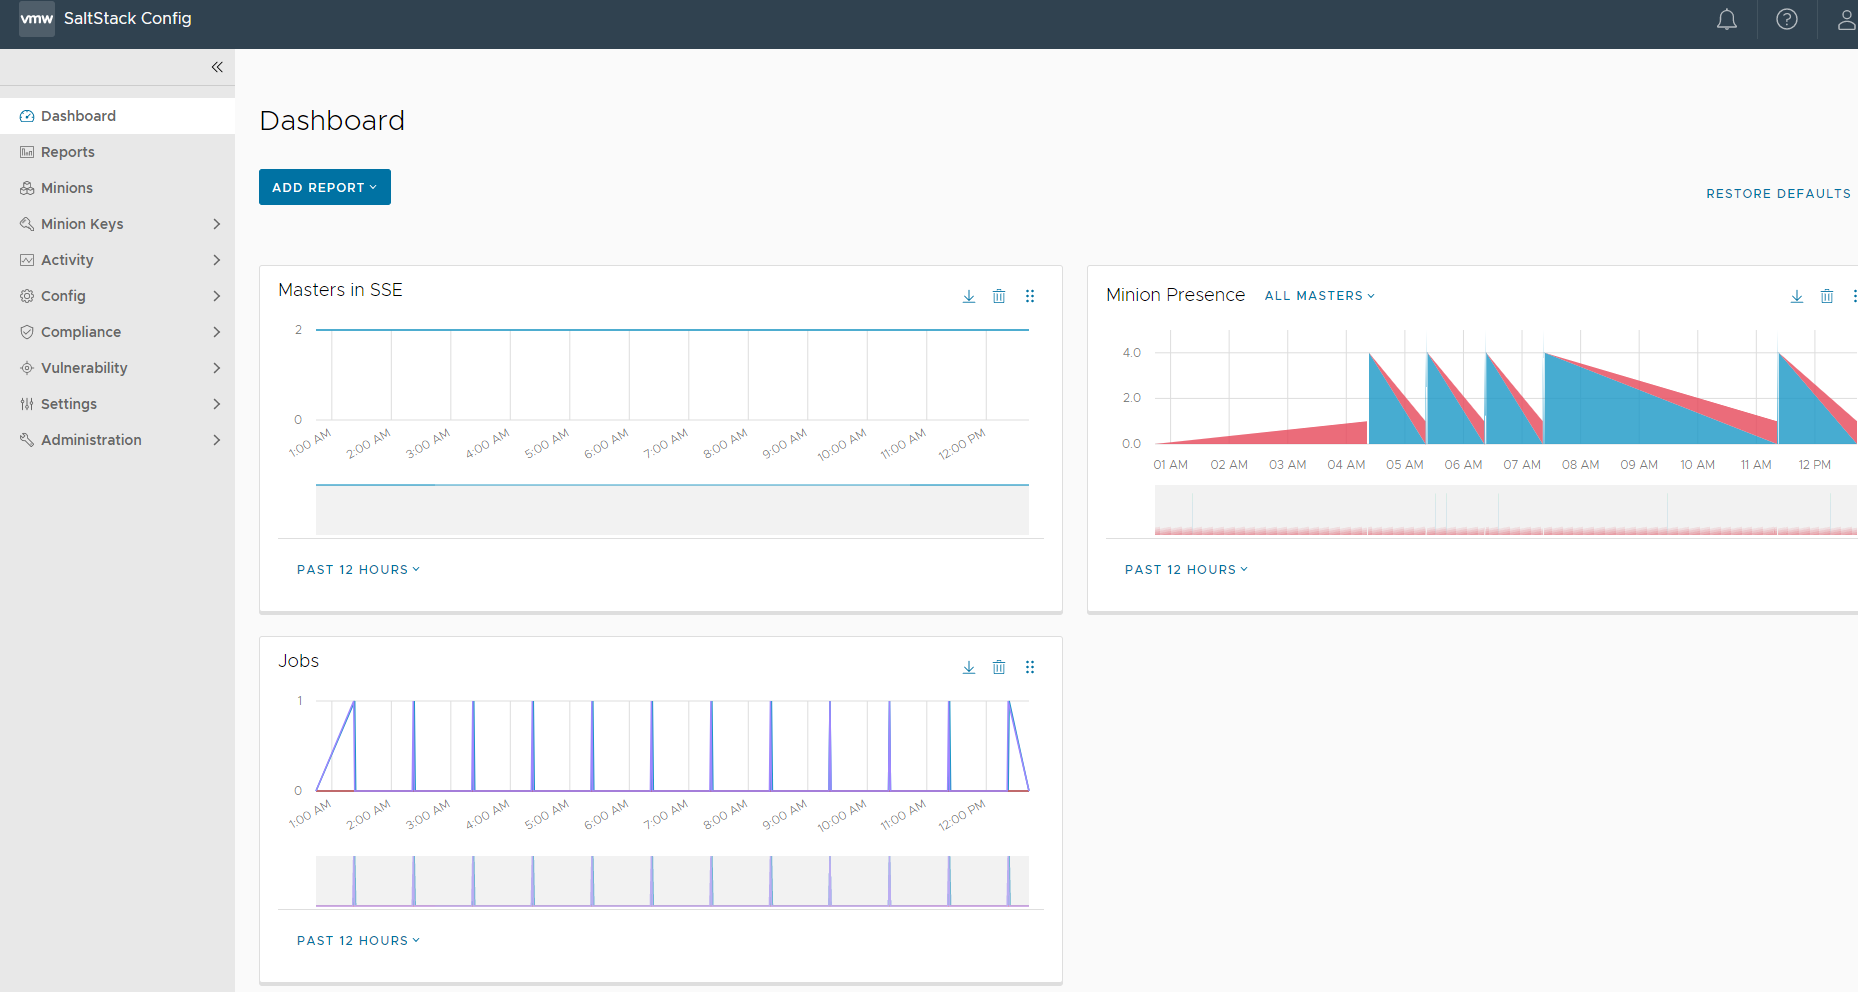
The Dashboard can visualize various kinds of system metrics and network data. You can view reports of the most recent system metrics using the Dashboard.

| Report | Description | Available filters |
|---|---|---|
| Salt Events |
|
|
| Salt Event Payload Size |
|
|
| Celery Queue Depth |
|
|
| RaaS Webserver Requests |
|
|
| Webserver Response Time |
|
|
| RaaS Salt Master Iteration Time |
|
|
| SSE Users Authenticated |
|
|
| Database Activity |
|
|
| Database Connections |
|
|
| Redis Commands Executed |
|
|
| Jobs |
|
|
| Salt Masters in SSE |
|
|
| Minion Presence |
|
|
For information on system metrics, see Monitoring your system metrics using SaltStack Config.
Adding reports
To add a report to the Dashboard:
- In the Dashboard workspace, click Add Report to open a menu.
- Select the name of the report you want to add to the Dashboard.
The report you selected now appears in the Dashboard. If you already have several reports in your Dashboard, the new report you just added appears at the top of the Dashboard on either the left or right column. It appears in whichever column had the fewest reports at the time you added it.
All the reports in the Dashboard workspace can be filtered by the duration of time shown in the report, from the past hour up to 24 hours. All reports are set to 12 hours by default. To change the duration, click the duration filter in the lower left of the report to select a different time range.
You can also download reports by cliking the Download icon  and selecting Download JSON or Download CSV.