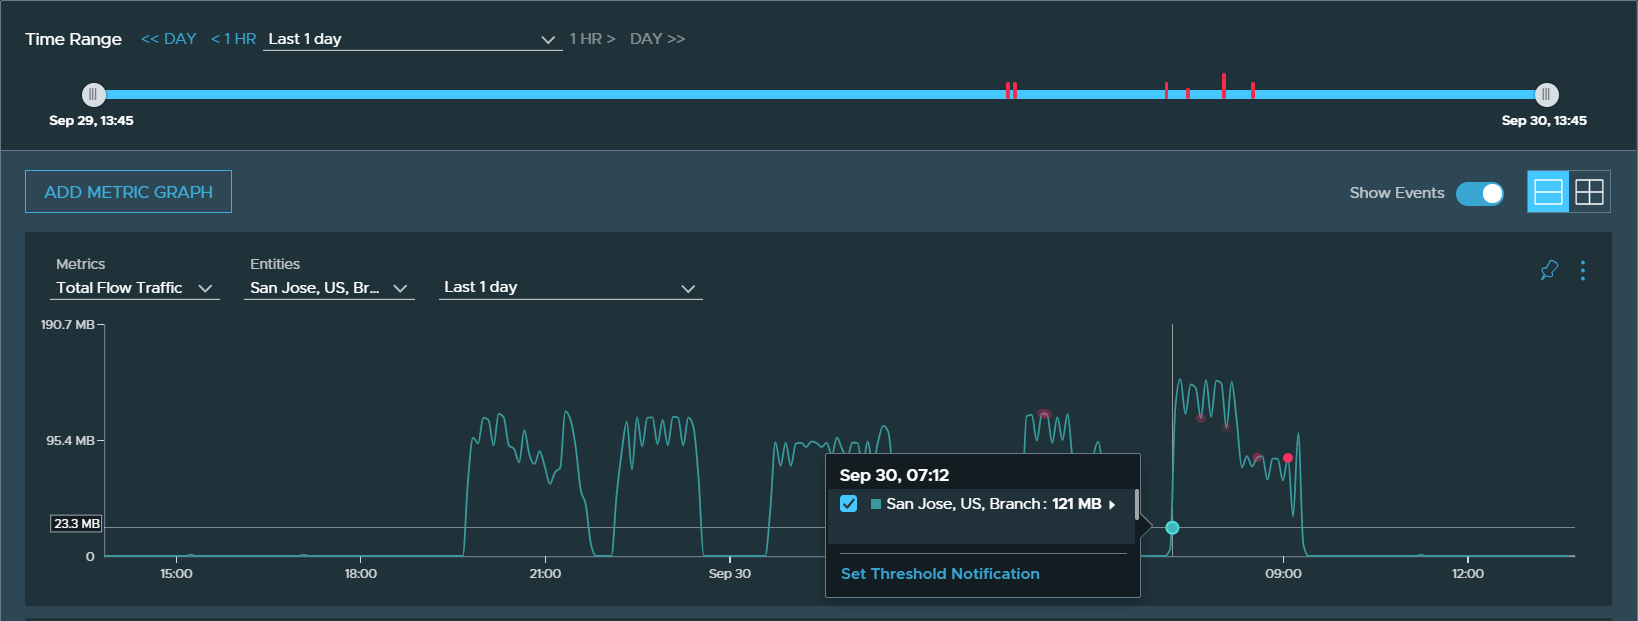
The metrics pins show important metrics pertaining to the selected entity.
The metrics pin uses the line graph to display data. You can point to the line graph to get informative tool tips. You can also co-relate multiple entities or two metrics graphs at the same time.
You can modify the time range of a metric by either using the slider or entering in a custom date/time. You can also adjust the time range for each entity with in a metric.
You can select different metrics, entities, and time from drop-down menu available in every metric chart. You can also adjust the view by selecting row view or column view by selection the view button in the top-right corner of the metrics chart. You can export the individual metrics graph in CSV format.
Following is an example of metrics chart. This show the total flow traffic in a VMware SD-WAN Edge.
