


To display different types of metrics on the user interface, vRealize Network Insight collects data from multiple data sources. Each piece of data collected is called a metric observation or a metric value.
vRealize Network Insight displays the following metrics on the user interface:
| Metric Type | Description | Data Sources Supporting the Metric |
|---|---|---|
| Entity metrics | Entity metrics display information such as resource utilization and performance of entities in your network. They include metrics such as host metrics, VM metrics, datastore metrics, and so on. See Entity Metrics to learn more. |
All data sources added to vRealize Network Insight except ServiceNow, Infoblox, and vRealize Log Insight data sources. |
| Flow metrics | Flow metrics display the traffic flow data collected from flow-enabled data sources on your network.
The flow data from the data sources is:
See Flow Metrics to learn more. |
|
| Health metrics | Health metrics represent the overall health of the vRealize Network Insight instance. These metrics are useful in diagnosing health problems related to the vRealize Network Insight instance. |
vRealize Network Insight Collector and Platform |
| VM network utilization metrics | The VM network utilization metrics display the performance of the VM based on network utilization. These metrics are critical to track network activity and throughput. In vRealize Network Insight, these metrics are displayed at 20 second resolution to showcase the peaks and troughs of network utilization.
Note:
VM network utilization metrics are displayed at 20 seconds granularity only if you are viewing the metric chart within the last 48 hours. Beyond 48 hours, the metric resolution is displayed based on the selected time range. See VM Network Utilization Metrics to learn more. |
VMware vCenter |
Comprehending Metric Data
You can view your metric data at different levels of granularity, based on the time range. For example, you can choose a one day view, which can be useful when troubleshooting. Or, choose a broader time range (for example, 30 days) so that you can see trends over time.
When you view metric data for different time ranges, you see different values indicated in the metric chart. This difference is because vRealize Network Insight displays different resolutions of data for different time ranges.
The default time range of any metric in vRealize Network Insight is 1 day and the resolution is 5 minutes. As the metric resolution becomes coarser, the metric data is down-sampled. That is, the resolution of the data is reduced. This is performed to create better metric graph visualizations by retaining only the important characteristics of the metric.
Time range and metric resolution for entity metrics:
| Time Range | Metric Resolution |
|---|---|
| 0 hours – 3.5 days | 5 minutes |
| 3.5 days – 15 days | 30 minutes |
| 15 days – 60 days | 2 hours |
| Beyond 60 days | 8 hours |
Time range and metric resolution for flow metrics:
| Time Range | Metric Resolution |
|---|---|
| 0 hours - 24 hours (within last 24 hours) | 5 minutes |
| 0 hours - 24 hours (beyond last 24 hours) | 30 minutes |
| 1 day – 15 days | 30 minutes |
| 15 days – 31 days | 2 hours |
Time range and metric resolution for special VM network utilization metrics:
| Time Range | Metric Resolution |
|---|---|
| 0 hours – 6 hours (within last 48 hours) | 20 seconds |
| 0 hours – 6 hours (beyond last 48 hours) | 5 minutes |
| 6 hours – 3.5 days | 5 minutes |
| 3.5 days – 15 days | 30 minutes |
| 15 days – 60 days | 2 hours |
| Beyond 60 days | 8 hours |
Viewing Metric Data
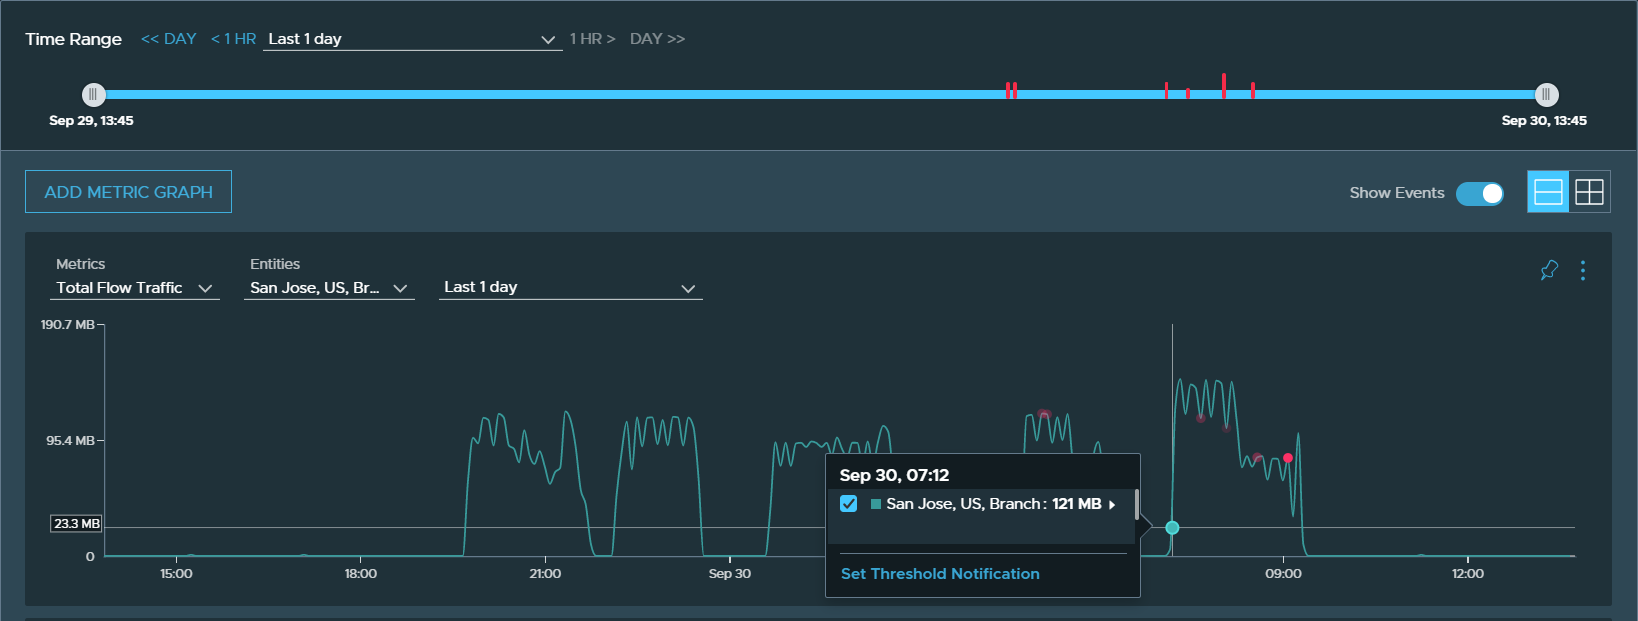
In vRealize Network Insight, the metric data of an entity is displayed as line graph on the metric chart. You can point anywhere on the line graph to get informative tool tips. You can also co-relate multiple entities or two metrics graphs at the same time.
You can modify the time range of a metric by either using the slider or entering in a custom date and time. You can also adjust the time range for each entity within a metric.
You can select different metrics, entities, and time from the drop-down menu that is available in every metric chart. You can also adjust the view to a row view or a column view by using the view button in the top-right corner of the metrics chart. You can also export individual metrics graph in CSV format.
Here is an example metrics chart that shows the total flow of traffic in a VMware SD-WAN Edge device.
Setting the Retention Interval
In vRealize Network Insight, you can choose how long the system retains metric data before automatically deleting it by setting the retention interval for each metric.
To set the retention interval of a metric, navigate to the page. To learn more, see Configure Data Retention Interval.
The minimum and maximum retention intervals defined by the system is as follows. Based on your business requirement, you can choose an interval between these values.
| Metric Type | Resolution | Minimum Retention | Maximum Retention |
|---|---|---|---|
| Entity metrics |
5 minutes | 1 month | 13 months |
| 30 minutes | 1 month | 13 months | |
| 2 hours | 1 month | 13 months | |
| 8 hours | 1 month | 13 months | |
| Flow metrics
Note: You cannot edit the retention interval of flow metrics on the
vRealize Network Insight UI.
|
5 minute | 24 hours | 24 hours |
| 30 minutes | 1 month | 1 month | |
| 2 hours | 1 month | 1 month | |
| Health metrics |
5 minutes | 1 month | 13 months |
| 30 minutes | 1 month | 13 months | |
| 2 hours | 1 month | 13 months | |
| 8 hours | 1 month | 13 months | |
| VM network utilization metrics |
20 second
Note: You cannot edit the retention interval of VM network utilization metrics with 20 seconds resolution on the
vRealize Network Insight UI.
|
2 days | 2 days |
| 5 minutes | 1 month | 13 months | |
| 30 minutes | 1 month | 13 months | |
| 2 hours | 1 month | 13 months | |
| 8 hours | 1 month | 13 months |
The retention interval you choose has a direct impact on disk space.
Reducing the log retention period deletes all logs older than the new retention period specified. For example, changing the retention period of the entity metrics from 6 months to 1 month deletes all logs older than a month. Therefore, consider backing up your log files before reducing the retention period.
Increasing the log retention period adds new logs to the collection. Therefore, check the available disk space and consider upgrading your disk space when increasing the log retention period.
