


There are many types of pins in vRealize Network Insight. Most of the pins that are available in the software can be categorized into the following:
Metrics Pins
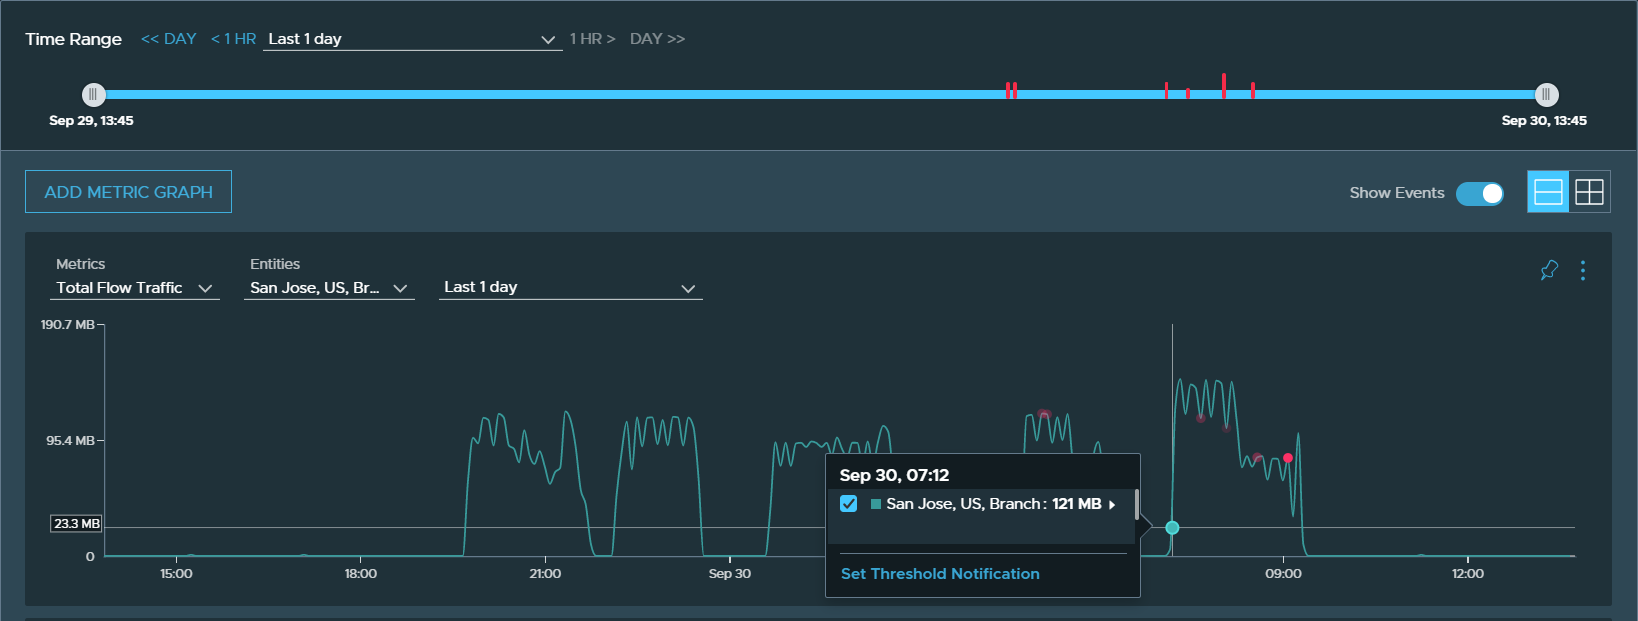
Metrics pins show important metrics pertaining to the selected entity.
A metrics pin uses the line graph to display data about the selected entity. You can point anywhere on the line graph to get informative tool tips. You can also co-relate multiple entities or two metrics graphs at the same time.
Here is an example metrics chart that shows the total flow of traffic in a VMware SD-WAN Edge device.
Entity List View Pins
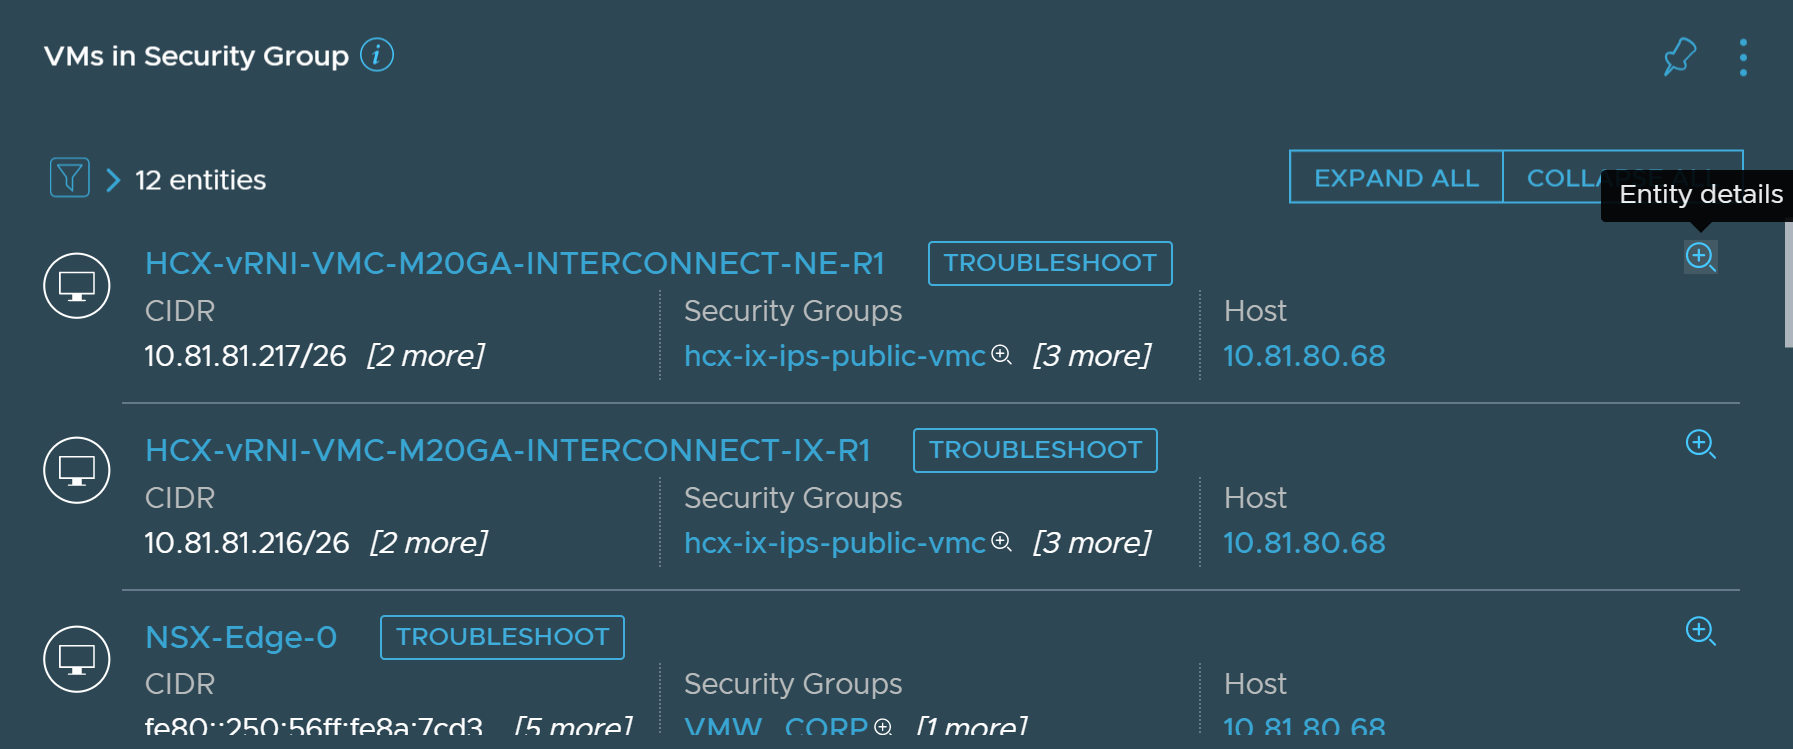
The entity list view pins display a list of entities that are grouped by a common theme. The list shows important attributes per entity.
You can see more attributes of a particular entity by clicking the magnify icon on the far right. You can also click the entity name to navigate to the respective entity page.
Like other pins, the filter icon houses various facets to filter the list. An example of the entry list view pin is VMs by security groups. By default, this pin shows the VMs that are part of the same security group. You can also filter VMs by properties such as VXLAN, OS hostname, vendor ID, and datastore.
Alert View List Pins
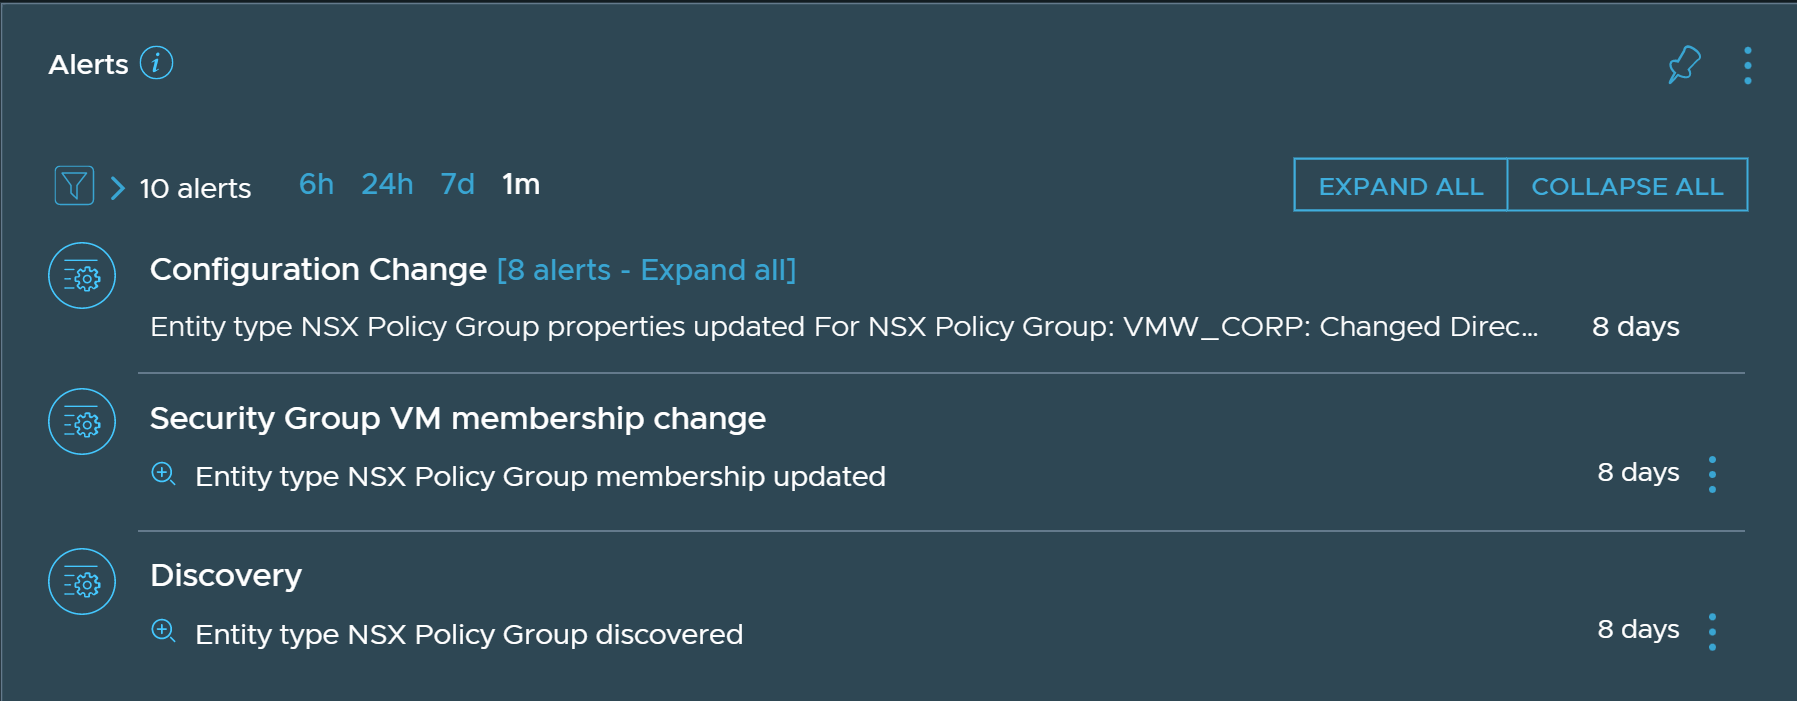
The alerts list view pins provide a list of alerts in the chronological order for a particular entity or group of entities.
You can change how far back in time (from now) must the pin show alerts by using the available presets or entering in a custom date/time. Other filter options such as Alert Status and Alert Type can be selected by clicking the filter icon.
Here, the alerts related to an NSX policy group are displayed. You can expand an alert and click the entity name to navigate to the entity page and view alerts related to that entity. By clicking the filter icon you can filter the alerts based on their status and type.
You can search for the alerts by using the alerts search query. You can search for open or closed alerts with queries such as open alerts or closed alerts. You can also search for problems with the same modifiers.
