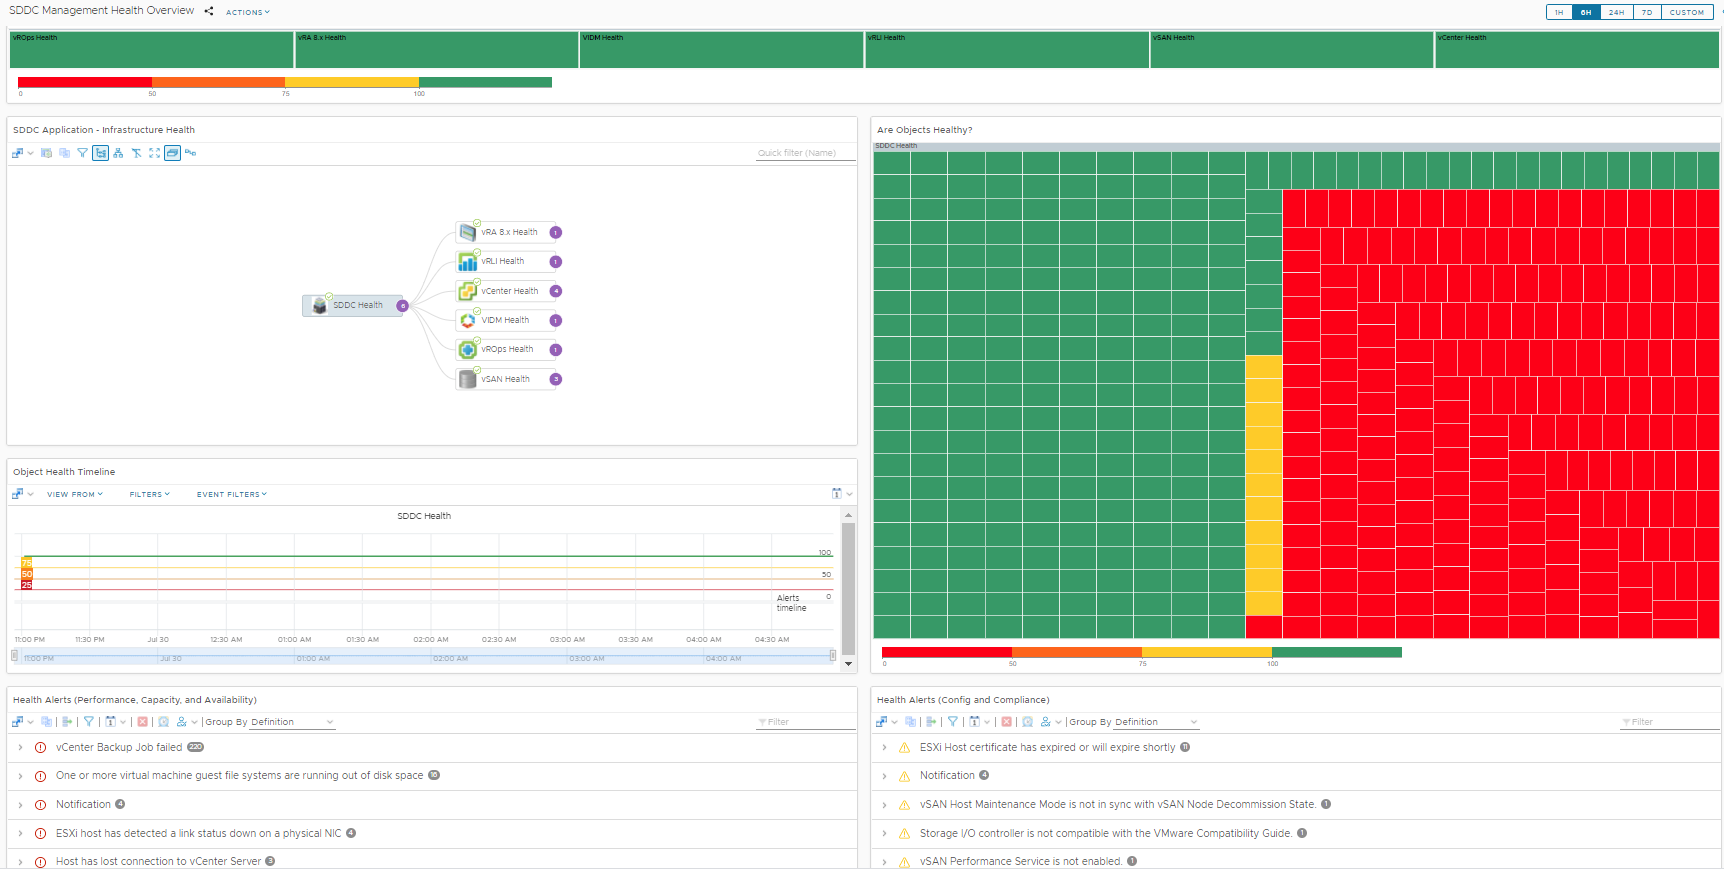
You can use SDDC Management Health overview dashboard to view and analyze the application-specific problems in the SDDC components. The SDDC Health Dashboard provides the health information for each of the components in the SDDC stack. You can select the component in the SDDC stack from the widgets available in the dashboard. The widgets help in rendering the infrastructure health of that component with its service health and associated configuration alerts, if any.

The dashboard displays several widgets.
| Widget | Description |
|---|---|
| SDDC Products - Health Overview | This widget provides the health of all the products and are represented in the form of badges. The widget displays the different components and its health that are available in the SDDC health dashboard. |
| SDDC Application: Infrastructure Health | This widget displays the associated cluster nodes for a selected product group. When you select a product group from the SDDC health overview, the corresponding graphical representation of that group appears in this widget. You can double-click a node in a cluster of a product group. When you select a node, the associated health is populated in the next widget. |
| Are Objects Healthy? | This widget displays a heatmap that displays the health of all the objects in a component from the SDDC Application: Infrastructure Health widget. |
| Object Health Timeline | This widget displays charts that show different aspects of the behavior of a selected resource. By default, the charts show data for the past six hours. |
| Critical Alerts |
This widget provides two types of critical alerts of a product instance:
|