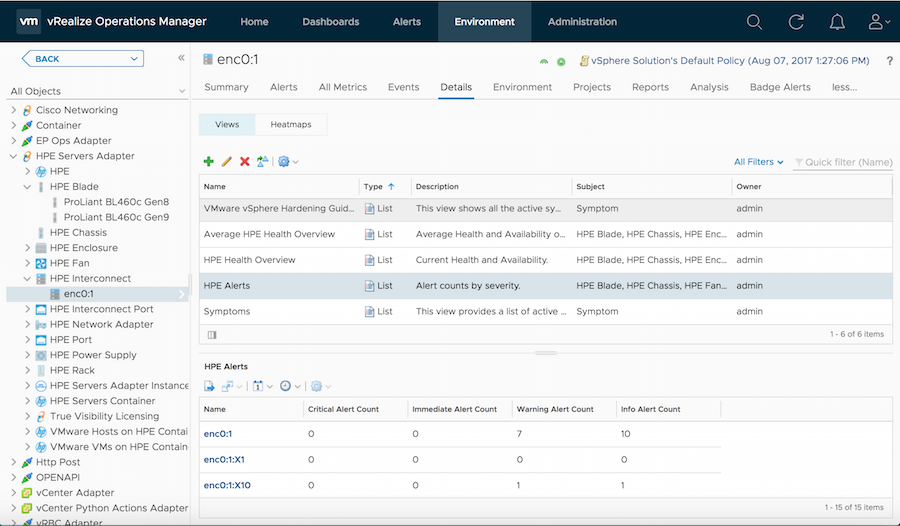
The Management Pack for HPE ProLiant creates views that allow the user to view statistics of metrics for various HPE ProLiant resources. The views help give a broad picture of the entire system, as opposed to a more in depth view.
The following views are available in the Management Pack:
| View | Type | Description |
|---|---|---|
| Average HPE Health Overview | List | Displays average health and availability over the past week |
| HPE Alerts | List | Displays alert counts by severity |
| HPE Capacity | List | Displays capacity (%) and time (days) remaining |
| HPE Chassis Average KPIs | List | Displays average chassis KPIs over the past week |
| HPE Fan KPIs | List | Displays KPIs for HPE fans |
| HPE Health Overview | List | Displays current health and availability |
| HPE Network Adapter Average KPIs | List | Displays average network adapter KPIs over the past week |
| HPE Port Average KPIs | List | Displays average port KPIs over the past week |
| HPE Power Supply KPIs | List | Displays KPIs for HPE power supplies |
| HPE Server Information | List | Displays KPIs and alert counts by severity for HPE blade and rack servers |
To access the Management Pack views:
- Navigate to Environment > All Objects > HPE ProLiant.
- Double-click on the desired object (resource).
- Select the Details tab, then Views.
The available views for that resource are listed and can be selected.
Accessing Views
