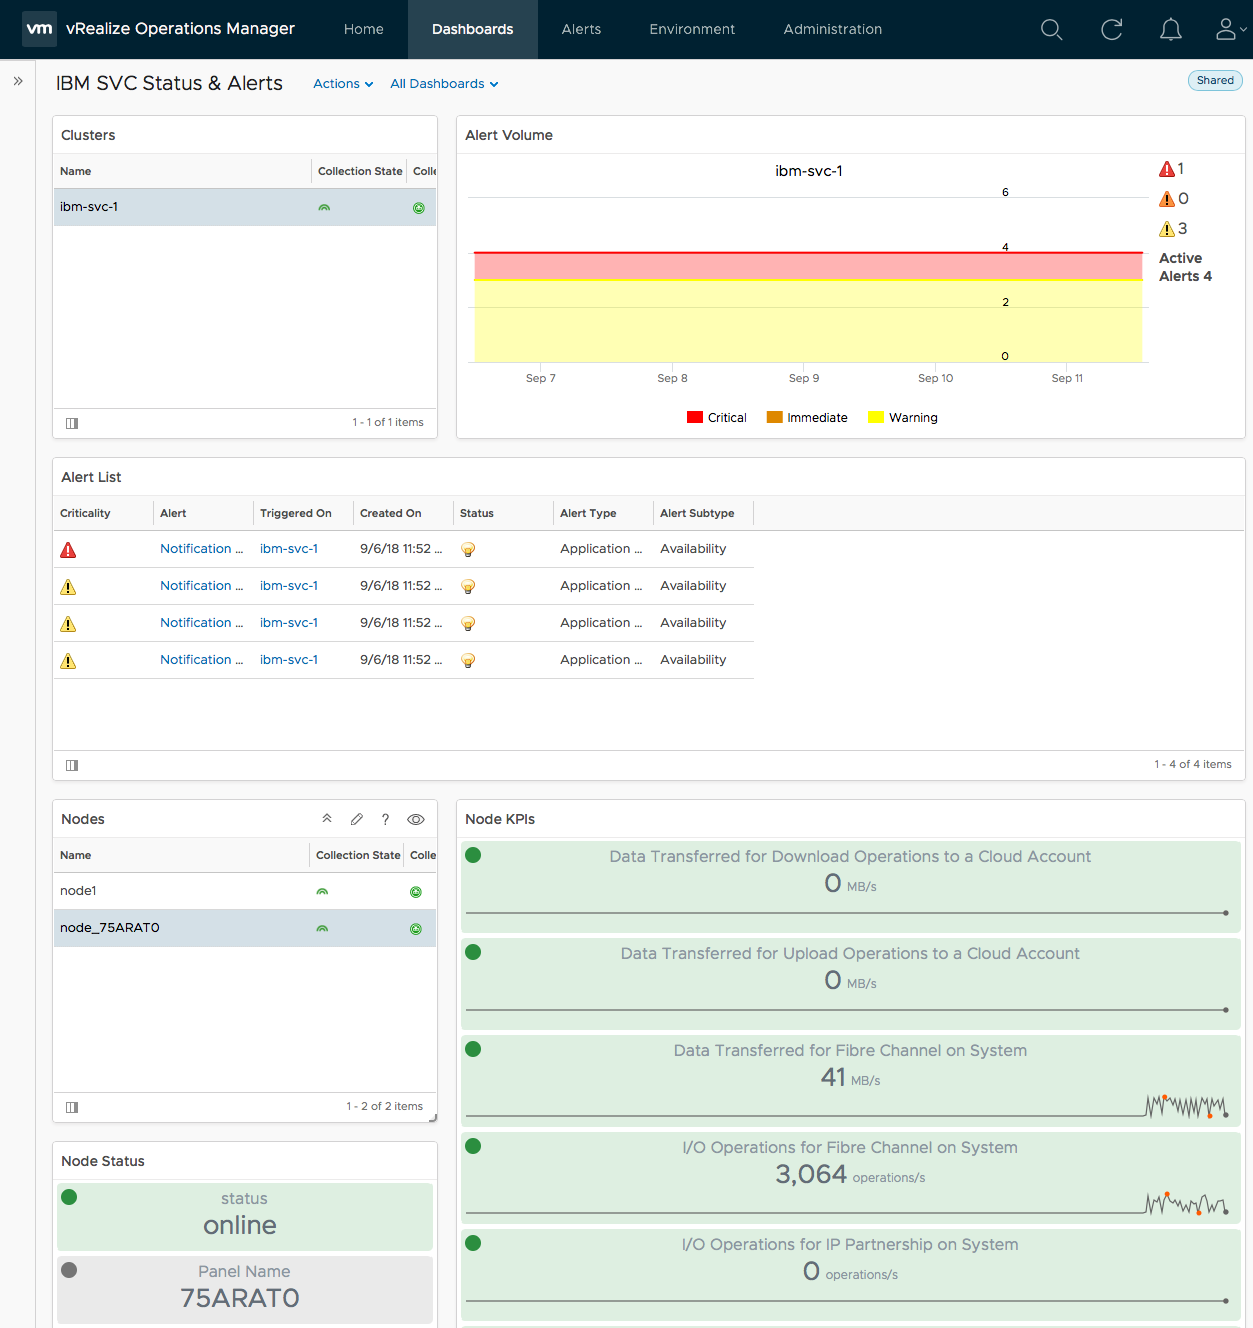
The IBM SVC Status & Alerts dashboard gives you a cluster-based overview of alerts in your environment, including an alert volume graph that gives you a perspective on the quantity of alerts over a period of time, allowing you to more easily pinpoint the time that a given problem may have occurred. Additionally there is a node-level breakdown of KPIs, allowing more in depth troubleshooting without leaving the dashboard.
