The Microsoft SQL Server Query Plan dashboard allows you to investigate why a query is performing poorly. Select a SQL Server instance to populate the Query Average Execution Time widget as a starting point. Next, select the query you want to investigate further. The query text will populate on the right for reference, and you can then generate the query plan using vROps Actions to help debug. The action on a selected query resource kicks off collection to retrieve an XML-based query plan from SQL Server.
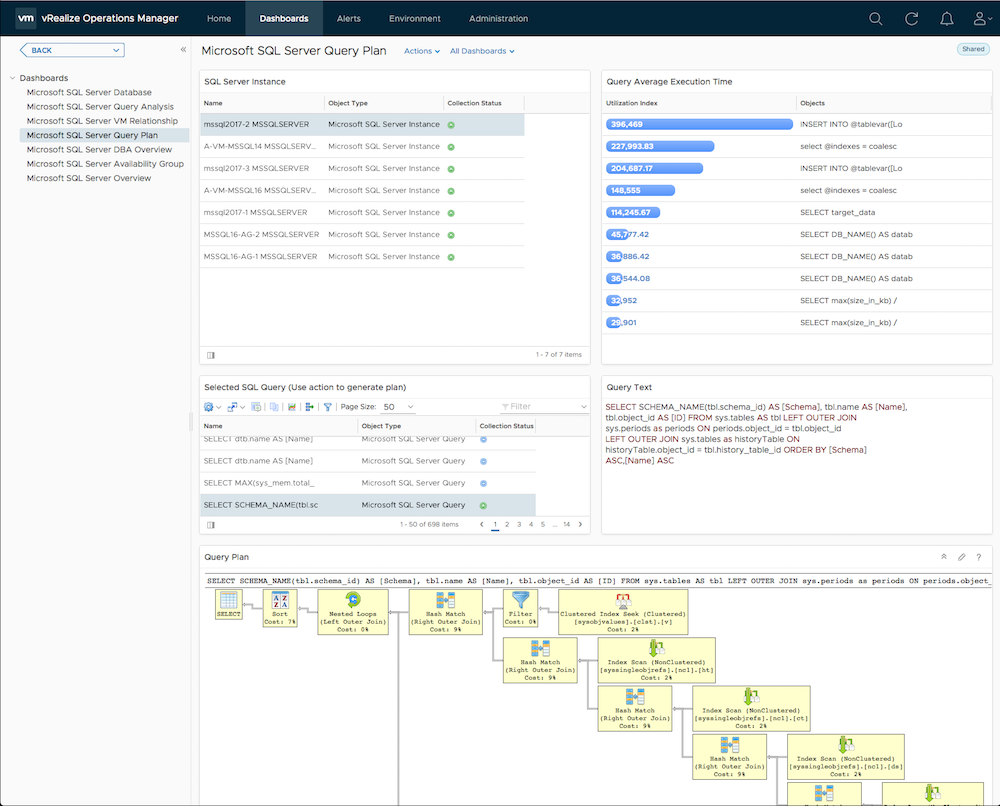
Generating a Query Plan
To generate a query plan:
- Select a SQL query from the Selected SQL Query (Use action to generate plan) widget.
-
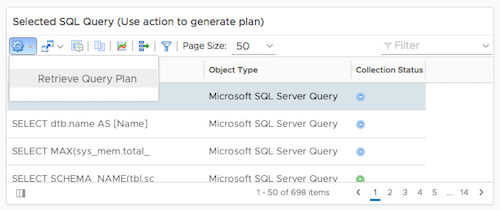
From the Actions
 drop-down, select Retrieve Query Plan.
-
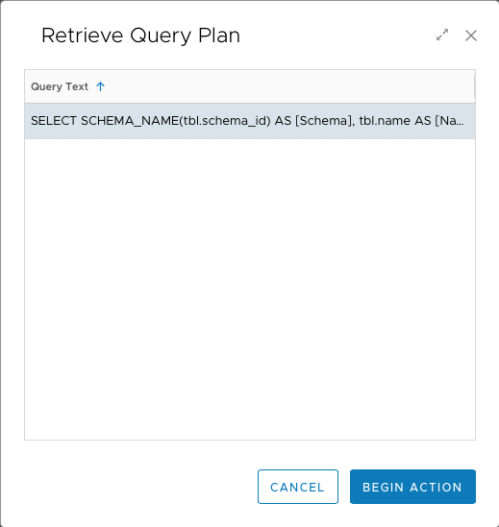
In the Retrieve Query Plan window that appears, confirm the selected query is correct, then click Begin Action.
-
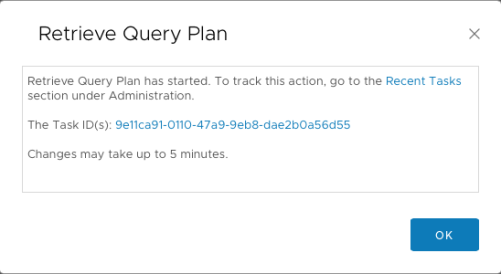
A confirmation dialog will appear, notifying you that the action to retrieve the query plan has started, and that you can track the status of the action from Recent Tasks. Click OK to dismiss the dialog.
Note: It make take up to 5 minutes for the generated query plan to load in the Query Plan dashboard widget. You may need to refresh the page for it to load into the widget.
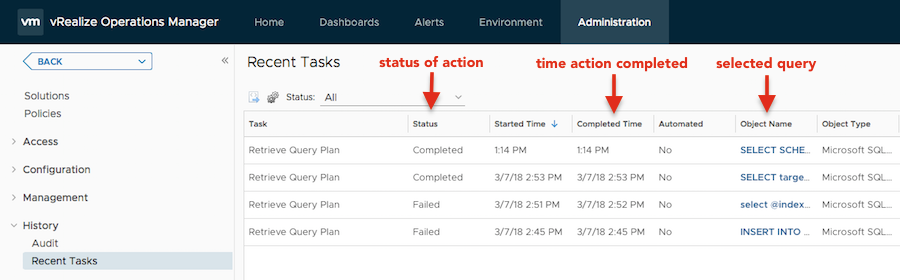
Note: If the query plan doesn't populate in the Query Plan widget, click the Recent Tasks link from the dialog (also accessible from Administration > History > Recent Tasks) to check the status of the Retrieve Query Plan action.