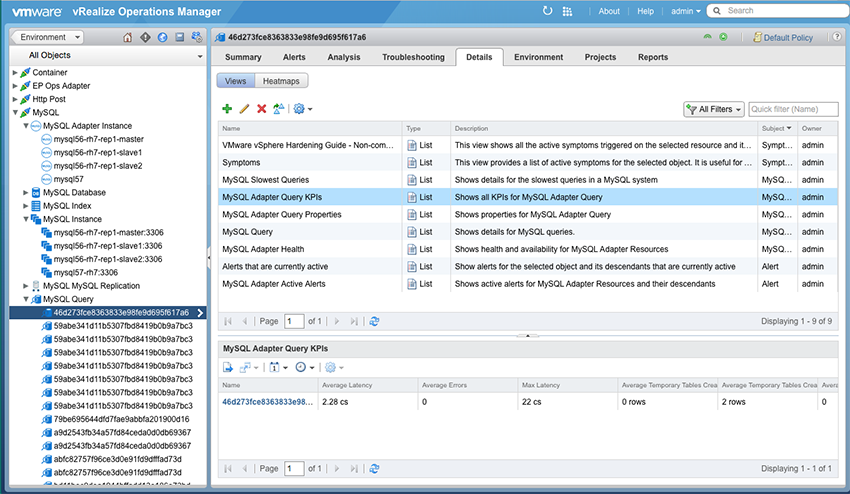
The Management Pack for MySQL creates views that allow the user to view statistics of metrics for MySQL resources. The views help give a broad picture of the entire system, as opposed to a more in depth view.
The following views are available in the Management Pack:
| View | Type | Description |
|---|---|---|
| MySQL Adapter Active Alerts | List | Shows active alerts for MySQL adapter resources and their descendants |
| MySQL Adapter Database KPIs | List | Shows all KPIs for MysQL adapter database |
| MySQL Adapter Health | List | Shows health and availability for MySQL adapter resources |
| MySQL Adapter Instance KPIs | List | Shows all KPIs for MySQL adapter instance |
| MySQL Adapter Instance Properties | List | Shows properties for MySQL adapter instance |
| MySQL Adapter Query KPIs | List | Shows all KPIs for MySQL adapter query |
| MySQL Adapter Query Properties | List | Shows properties for MySQL adapter query |
| MySQL Adapter Replication Master Properties | List | Shows properties for MySQL adapter replication master |
| MySQL Adapter Replication Slave Properties | List | Shows properties for MySQL adapter replication slave |
| MySQL Adapter Table KPIs | List | Shows all KPIs for MySQL adapter table |
| MySQL Adapter Tablespace Properties | List | Shows properties for MySQL adapter tablespace |
| MySQL Database Overview | List | Shows an overview of MySQL databases |
| MySQL Database Usage (Historic Data) | Trend | Shows the trends in the number of rows inserted, updated, and deleted for a given database |
| MySQL Instance Overview | List | Shows an overview of MySQL instances |
| MySQL Instance Usage (Historic Data) | Trend | Shows the number of rows that have been inserted, updated, deleted, or selected for a given MySQL instance |
| MySQL Master | List | Shows master properties |
| MySQL Master Stats | List | Shows master stats |
| MySQL Query | List | Shows details for MySQL queries |
| MySQL Query Text | Text | Shows the query text for the selected MySQL query |
| MySQL Slave | List | Shows slave properties |
| MySQL Slowest Queries | List | Shows details for the slowest queries in a MySQL system |
| MySQL Table Usage (Historic Data) | Trend | Shows the number of rows inserted, updated, and deleted for a given MySQL table as a trend |
| MySQL Throughput | List | Shows I/O related information for MySQL systems |
To access the Management Pack views:
- Navigate to Environment > All Objects > MySQL.
- Double-click on the desired object (resource).
- Select the Details tab, then Views.
The available views for that resource are listed and can be selected.
Accessing Views
