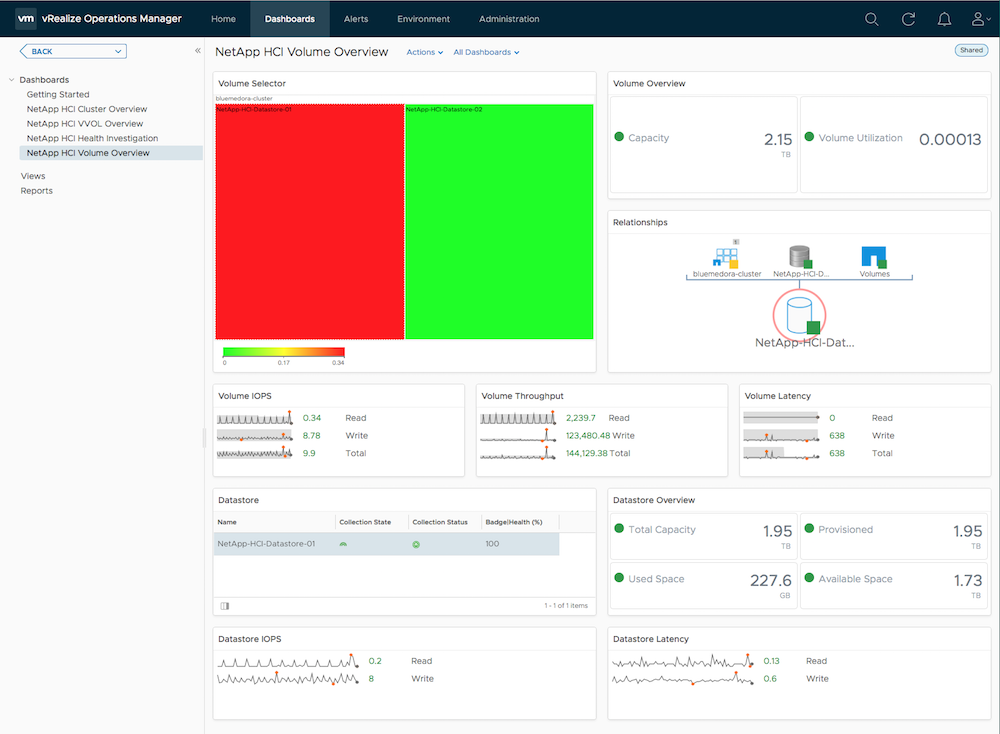
The NetApp HCI Volume Overview dashboard provides an overview of your volume capacity, utilization, performance, and relationships, as well as insight into your volume's related datastore(s). Click on a volume from the heatmap-based Volume Selector widget to populate the Volume Overview, Relationships, and IOPS, Throughput, and Latency widgets. You can then select a related datastore to view additional KPIs for the selected resource.
Note: The heatmap selector widget shows health by default, but can be switched to display by IOPS, Throughput, or Latency using the toolbar.
