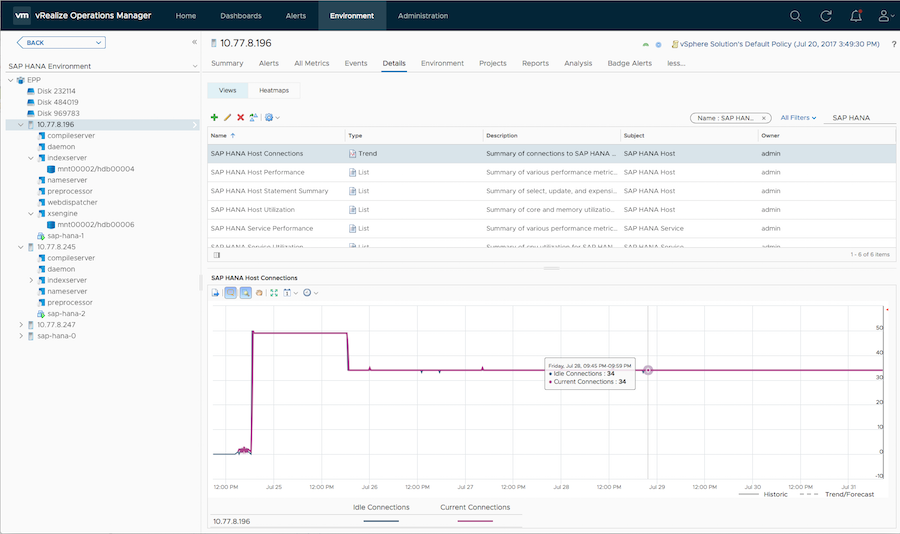
The Management Pack for SAP HANA creates views that allow the user to view statistics of metrics for various SAP HANA resources. The views help give a broad picture of the entire system, as opposed to a more in depth view.
The following views are available in the Management Pack:
| View | Type | Description |
|---|---|---|
| SAP HANA Host Connections | Trend | Summary of connections to SAP HANA Host |
| SAP HANA Host Performance | List | Summary of various performance metrics for SAP HANA Hosts |
| SAP HANA Host Statement Summary | List | Summary of select, update, and expensive statements for SAP HANA Host |
| SAP HANA Host Utilization | List | Summary of core and memory utilization for SAP HANA Hosts |
| SAP HANA Service Performance | List | Summary of various performance metrics for SAP HANA Services |
| SAP HANA Service Utilization | List | Summary of CPU utilization for SAP HANA Services |
| SAP HANA System Performance | List | Summary of various performance metrics for a SAP HANA System |
| SAP HANA System Request Summary | List | Summary of requests rate and response time for SAP HANA Systems |
| SAP HANA System Utilization | List | Summary of core and memory utilization for SAP HANA System |
To access the Management Pack views:
- Navigate to Environment > All Objects > SAP HANA.
- Double-click on the desired object (resource).
- Select the Details tab, then Views.
The available views for that resource are listed and can be selected.
Accessing Views
