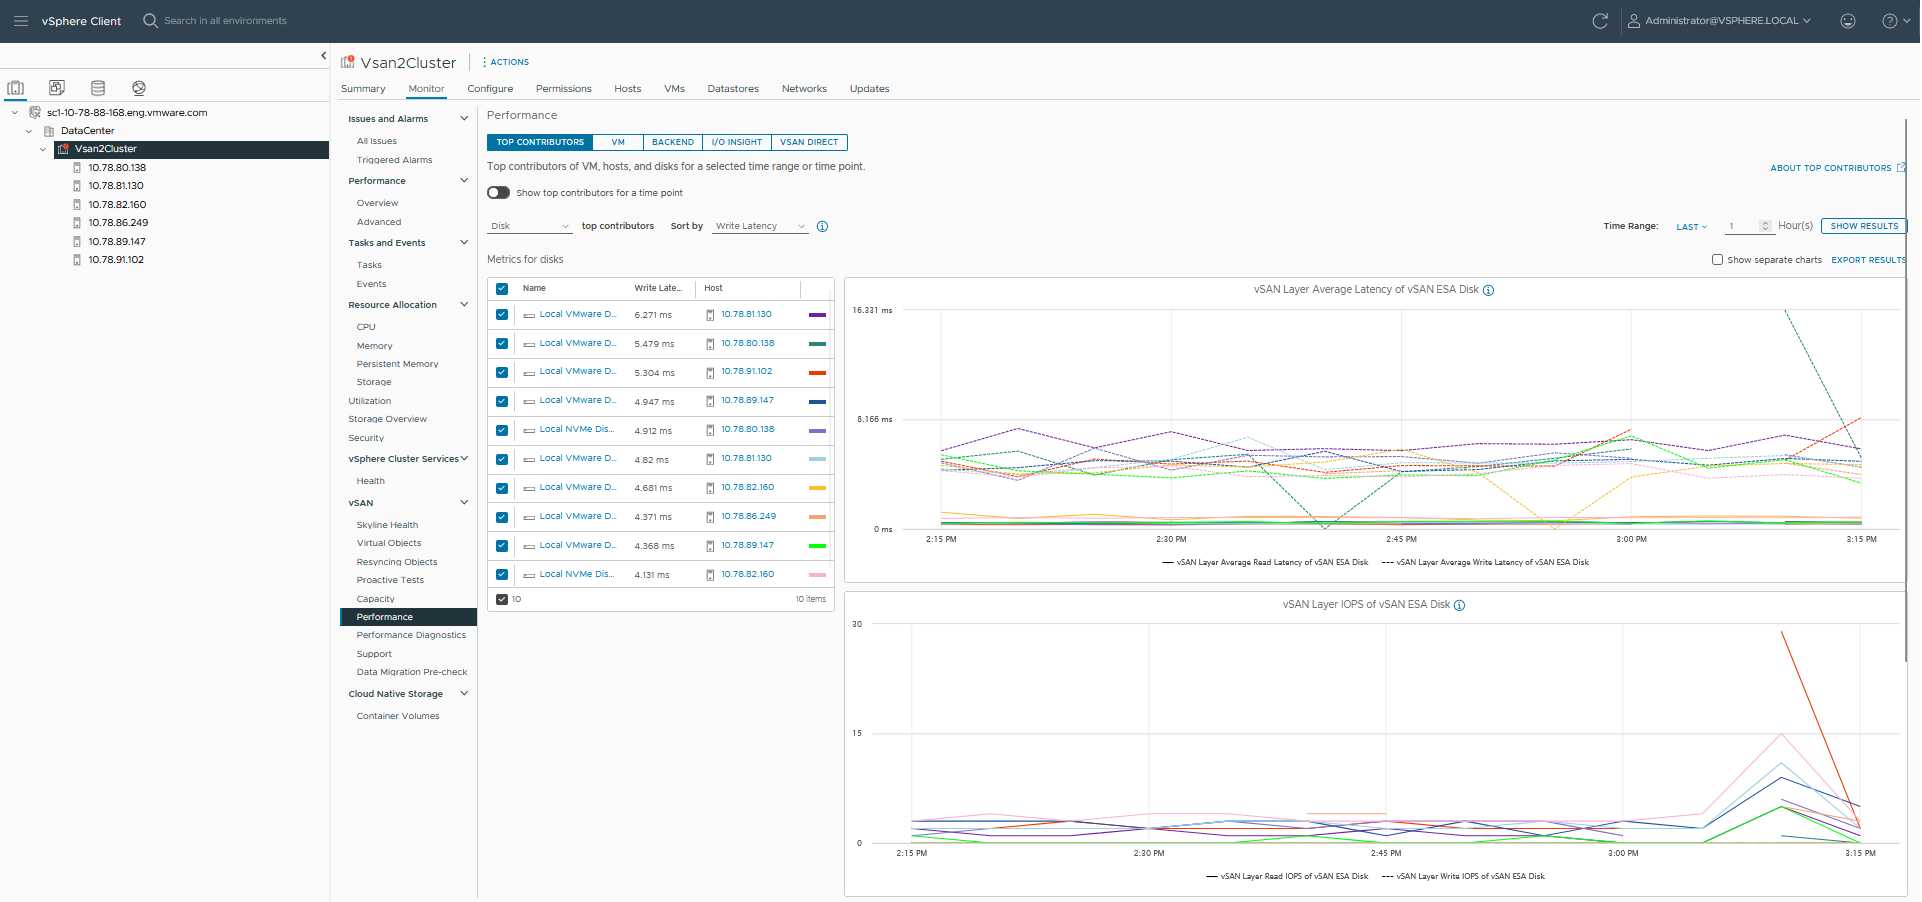
You can use the vSAN cluster performance charts to monitor the workload in your cluster and determine the root cause of problems.
When the performance service is turned on, the cluster summary displays an overview of vSAN performance statistics, including vSAN IOPS, throughput, and latency. At the cluster level, you can view detailed statistical charts for virtual machine consumption and the vSAN back end.
Note:
- To view iSCSI performance charts, all hosts in the vSAN cluster must be running ESXi 7.0 or later.
- To view file service performance charts, you must enable vSAN File Service.
- To view vSAN Direct performance charts, you must claim disks for vSAN Direct.
- To view PMem performance charts, you must have PMem storage attached to the hosts in the cluster.
Prerequisites
The vSAN performance service must be turned on before you can view performance charts.
Procedure
- Navigate to the vSAN cluster.
- Click the Monitor tab.
- Under vSAN, select Performance.
- Select Top Contributors.

Perform one of the following:
- Select a time range to view the hotspot entities in the charts. You can view the top 10 hotspot entities as aggregated metrics for the selected time range. You can view the hotspots of VMs, disk groups (vSAN OSA) or disks (vSAN ESA), host (backend), or host (frontend). You have the option to enable separate charts.
- Select a single timestamp to identify the VMs, disk groups (vSAN OSA) or disks (vSAN ESA), host (backend), or host (frontend) that consume the most IOPS, have the highest I/O throughput, or I/O latency. For example, based on the I/O latency graph of the cluster, you can select a timestamp and get the top contributors with latency statistics. You can also select a single contributor and view the latency graph. You have the option to switch between the combined view and table view.
- Select VM.
Perform one of the following:
- Select Cluster level metrics to display the aggregated performance metrics for the cluster that you selected.
- Select Show specific VMs to display metrics for all the VMs selected. If you enable Show separate chart by VMs, vSAN displays separate metrics for all the VMs selected.
Select a time range for your query.
vSAN displays performance charts for clients running on the cluster, including IOPS, throughput, latency, congestions, and outstanding I/Os. The statistics on these charts are aggregated from the hosts within the cluster. You can also select
Real-Time as the time range that displays real-time data that is automatically refreshed every 30 seconds. The real-time statistics data is retained in the SQL database for seven days until it gets purged.
- Select Backend. Select a time range for your query. vSAN displays performance charts for the cluster back-end operations, including IOPS, throughput, latency, congestions, and outstanding I/Os. The statistics on these charts are aggregated from the hosts within the cluster.
- Select File Share and choose a file. Select a time range for your query. Select NFS performance or File system performance based on the protocol layer performance or file system layer performance that you want to display. vSAN displays performance charts for vSAN file services, including IOPS, throughput, and latency.
- Select iSCSI and select an iSCSI target or LUN. Select a time range for your query. vSAN displays performance charts for iSCSI targets or LUNs, including IOPS, bandwidth, latency, and outstanding I/O.
- (Optional) Select I/O Insight. For more information on I/O Insight, see Use vSAN I/O Insight.
- Select vSAN Direct to display the performance data of the vSAN direct disks. Select a time range for your query. vSAN displays performance charts for vSAN direct, including IOPS, bandwidth, latency, and outstanding I/O.
- Select PMEM to display the performance data of all VMs placed on the PMem storage. Select a time range for your query. You can also select Real-time as the time range that displays real time data that is automatically refreshed every 30 seconds. PMem displays performance charts including IOPS, bandwidth, and latency. For more information about PMem metrics collection settings, see https://kb.vmware.com/s/article/89100.
- Click Refresh or Show Results to update the display.
