


You can monitor the capacity of the vSAN datastore, vSAN Direct storage, and Persistent Memory (PMem) storage.
You can analyze usage and view the capacity breakdown at the cluster level.
The cluster Summary page includes a summary of vSAN capacity. You also can view more detailed information in the Capacity monitor.
Procedure
- Navigate to the vSAN cluster.
- Click the Monitor tab.
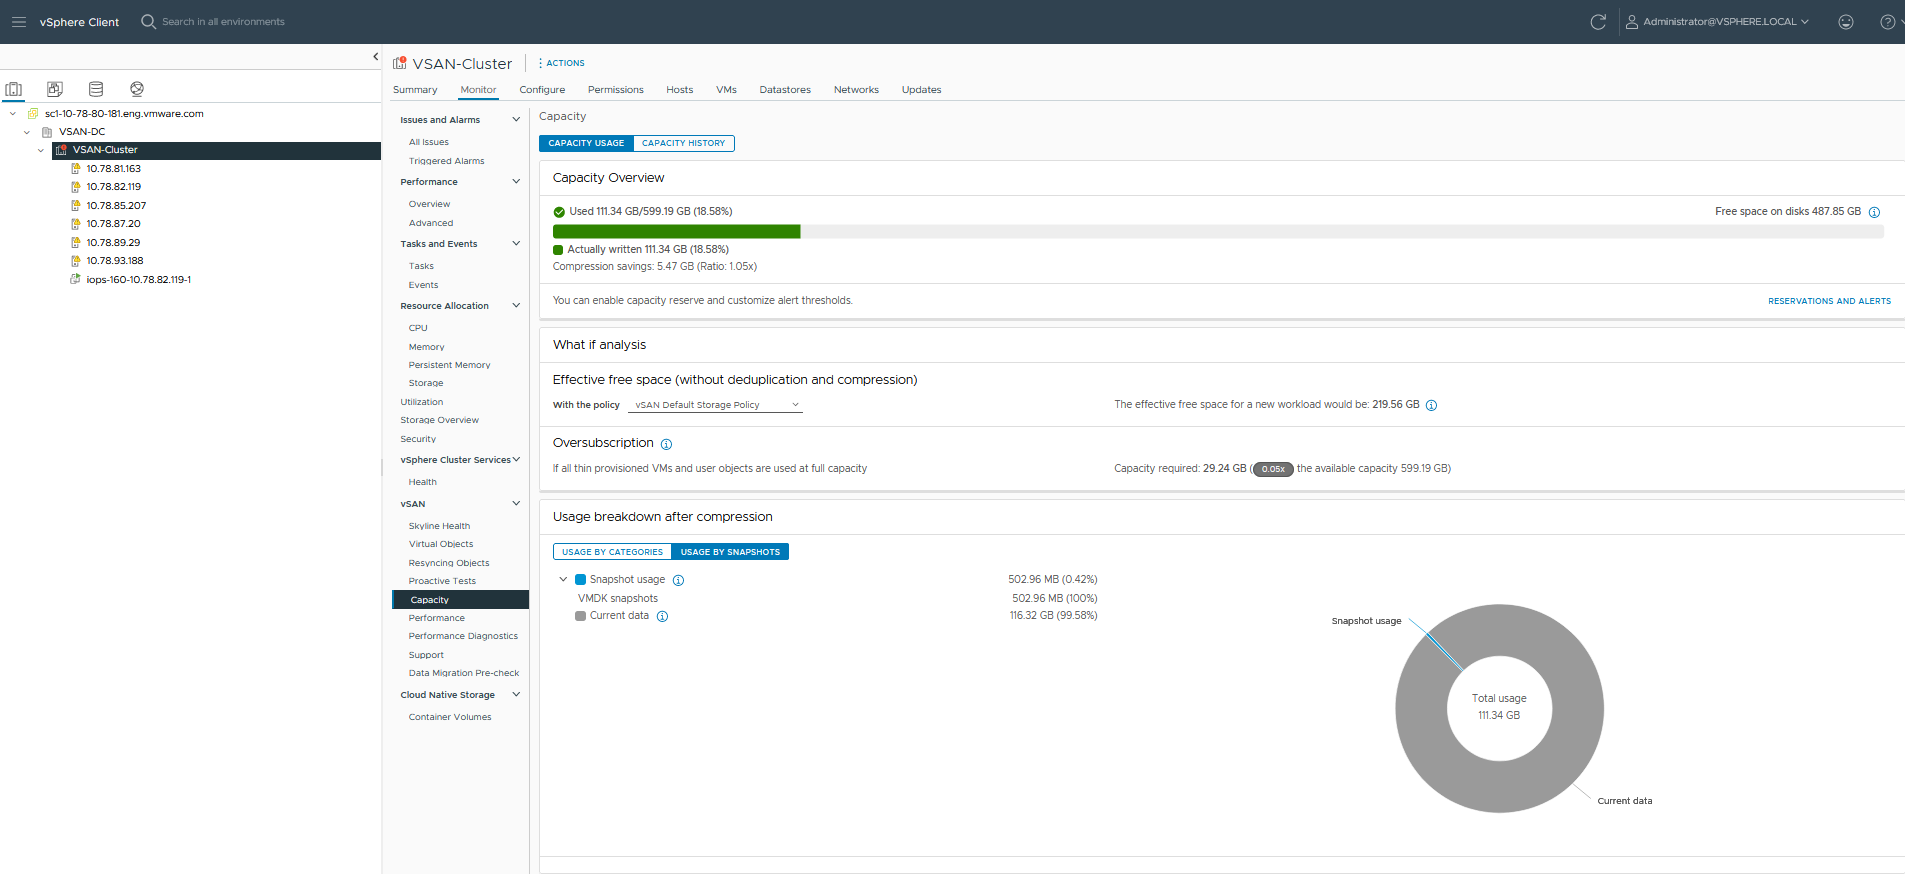
- Under vSAN, click Capacity to view the vSAN capacity information.
Results
- The Capacity Overview displays the storage capacity of the vSAN datastore, including free space available, used space, and the space that is actually written and physically consumed on the vSAN disks. For clusters that have deduplication and compression enabled, you can view the deduplication and compression savings and the deduplication and compression ratio.
Note: vSAN Express Storage Architecture (ESA) does not support deduplication.
Terms Description Free space Total free space available in the cluster Used space Total written physical space Actually written Actually used capacity. This capacity is displayed when deduplication or compression are not enabled. Compression savings Space saved when data compression is enabled. Object reserved Includes the reservation for objects created with a policy that has specified object space reservation. This capacity is not actually used by the objects. Reserved capacity Includes the operations reserve and the host rebuild reserve. - What if analysis enables you to estimate the effective free space while keeping the deduplication ratio as 1. Effective free space is an estimate of free space available based on the selected storage policy. The effective free space typically is smaller than the free space available on the disks, due to the cluster topology or the distribution of space across fault domains. For example, consider a cluster with 100 GB free space available on the disks. However, 100 GB cannot be provisioned as a single 100 GB object due to the distribution of free space across fault domains. If there are three fault domains and each fault domain has 33 GB free space, then the largest object that you can create with FTT 1 is 33 GB.
Oversubscription reports the vSAN capacity required if all the thin provisioned VMs and user objects are used at full capacity. It shows a ratio of the required usage compared with the total available capacity. While calculating the oversubscription, vSAN includes all the available VMs, user objects, and storage policy overhead, and does not consider the vSAN namespace and swap objects.
Note: Oversubscription is applicable only for vSAN hosts that are running 6.7 Update 1 or later.Note: PMem storage does not support What if analysis and Oversubscription.- The Usage breakdown before deduplication and compression displays the amount of storage space used by VMs, user objects, and the system. You can view a pie chart that represents the different usage categories. Click the pie chart to view the details of the selected category.
Following are the different usage categories available:
Category Description VM (user objects) usage Displays the following: - VM home objects - Usage of VM namespace object.
- Swap objects - Usage of VM swap files.
- VMDK - Capacity consumed by VMDK objects that reside on the vSAN datastore that can be categorized as primary data and replica usage. Primary data includes the actual user data written into the physical disk which does not include any overhead. Replica usage displays the RAID overhead for the virtual disk.
- VM memory snapshots - Usage of memory snapshot file for VMs.
- Block container volumes (attached to a VM) - Capacity consumed by the container objects that are attached to a VM.
- vSphere replication persistent state file - vSAN object used to store the persistent state file (PSF) at source site.
Non-VM (user objects) usage Displays iSCSI objects, block container volumes that are not attached to VM, user-created files, ISO files, VM templates, files shares, file container volumes, and vSAN objects used by the vSphere replication service at the target site. System usage Displays the following: - Performance management objects - Capacity consumed by objects created for storing performance metrics when you enable the performance service.
- File system overhead - vSAN on-disk format overhead that may take up on the capacity drives.
- ESA object overhead - vSAN ESA uses the capacity to store object metadata and to provide high performance.
- Checksum overhead - Overhead to store all the checksums.
- Dedup & compression overhead - Overhead to get the benefits of deduplication and compression. This data is visible only if you enable deduplication and compression.
- Operations usage - Temporary space usage in a cluster. The temporary space usage includes temporary capacity used for rebalance operations or moving objects due to FTT changes.
- Native trace objects - Capacity consumed by objects created for storing vSAN traces.
Note: PMem only supports VMDK, Non-Volatile Dual In-line Memory Module (NVDIMM), and file system overhead.
- The Usage breakdown before deduplication and compression displays the amount of storage space used by VMs, user objects, and the system. You can view a pie chart that represents the different usage categories. Click the pie chart to view the details of the selected category.
When you enable deduplication and compression, it might take several minutes for capacity updates to be reflected in the Capacity monitor, as disk space is reclaimed and reallocated. For more information about deduplication and compression, see "Using Deduplication and Compression" in Administering VMware vSAN.
In vSAN ESA, Usage by Snapshots displays the snapshot usage by the vSAN datastore. You can delete one or more snapshots and free the used space, thus managing space consumption. To delete a snapshot, right-click the virtual machine > Snapshots > Manage Snapshots. Click Delete to delete a snapshot. Click Delete All Snapshots to delete all the snapshots. The following are the different usage snapshots available:
| Snapshot | Description |
|---|---|
| Container volume snapshots | Displays the container volume snapshot usage in the vSAN datastore. |
| VMDK snapshots | Displays the VMDK snapshot usage in the vSAN datastore. |
| vSAN file share snapshots | Displays the file share snapshot usage in the vSAN datastore. |
| Current data | Displays the usage data that is not included in the snapshot usage data. You can calculate the current data by subtracting the total snapshot usage from the total used space. |
You can check the history of capacity usage in the vSAN datastore. Click Capacity History, select a time range, and click Show Results.
- Operations threshold - Displays the space vSAN requires to perform internal operations in the cluster. If the used space reaches beyond that threshold, vSAN might not be able to operate properly.
- Host rebuild threshold - Displays the space vSAN requires to tolerate one host failure. If the used space reaches beyond the host rebuild threshold and the host fails, vSAN might not successfully restore all data from the failed host.
- Operations reserve - Reserved space in the cluster for internal operations.
- Host rebuild reserve - Reserved space for vSAN to be able to repair in case of single host failure. The Capacity monitor displays the host rebuild threshold only when the host rebuild reserve is enabled.
If the resynchronization of objects is in progress in a cluster, vSAN displays the capacity used in the capacity chart as operations usage. In case there is enough free space in the cluster, vSAN might use more space than the operations threshold for the resyncing operations to complete faster.
Click Configure tab to enable the capacity reserve. You can also click Configure > vSAN > Services to enable the capacity reserve. For more information on configuring the reserved capacity, see Configure Reserved Capacity for vSAN Cluster.
In a cluster, if there is more utilization than the host rebuild threshold and the reserved capacity is not enabled, the capacity chart turns yellow as a warning. If the most consumed host fails, vSAN cannot recover the data. If you enable the host rebuild reserve, the capacity chart turns yellow at 80% of the host rebuild threshold. If the used space reaches beyond the operations threshold and the reserved capacity is not enabled, vSAN cannot perform or complete operations such as rebalance, resync object components due to policy changes, and so on. In that case, the capacity chart turns red to indicate that the disk usage exceeds the operations threshold. For more information about capacity reserve, see About Reserved Capacity in vSAN Cluster.
