Learn how to stream Supervisor metrics gathered by Telegraf to a custom observability platform. Telegraf is enabled by default on the Supervisor and it collects metrics in Prometheus format from Supervisor components, such as the Kubernetes API server, VM service, TKG, and others. As a vSphere Administrator, you can configure an observability platform such as VMware Aria Operations for Applications, Grafana, and others to view and analyse the collected Supervisor metrics.
Telegraf is a server-based agent for collecting and sending metrics from different systems, data bases, and IoT. Each Supervisor component exposes an endpoint where Telegraf connects. Telegraf then sends the collected metrics to an observability platform of your choice. You can configure any of the output plug-ins that Telegraf supports as an observability platform for aggregating and analyzing Supervisor metrics. See the Telegraf documentation for the supported output plug-ins.
The following components expose endpoints where Telegraf connects and gathers metrics: Kubernetes API server, etcd, kubelet, Kubernetes controller manager, Kubernetes scheduler, TKG, VM service, VM image service, NSX Container Plug-in (NCP), Container Storage Interface (CSI), certificate manager, NSX, and various host metrics such as CPU, memory, and storage.
View the Telegraf Pods and Configuration
Telegraf runs under the vmware-system-monitoring system namespace on the Supervisor. To view the Telegraf pods and ConfigMaps:
- Log in to the Supervisor control plane with an vCenter Single Sign-On administrator account.
kubectl vsphere login --server <control planе IP> --vsphere-username [email protected]
- Use the following command to view the Telegraf pods:
kubectl -n vmware-system-monitoring get pods
The resulting pods are the following:telegraf-csqsl telegraf-dkwtk telegraf-l4nxk
- Use the following command to view the Telegraf ConfigMaps:
kubectl -n vmware-system-monitoring get cm
The resulting ConfigMaps are as follows:default-telegraf-config kube-rbac-proxy-config kube-root-ca.crt telegraf-config
The
default-telegraf-configConfigMap holds the default Telegraf configuration and it is read-only. You can use it as fallback option to restore the configuration intelegraf-configin case the file is corrupt or you want to just restore to the defaults. The only ConfigMap that you can edit istelegraf-config, it defines which components are sending metrics to the Telegraf agents, and to which platforms. - View the
telegraf-configConfigMap:kubectl -n vmware-system-monitoring get cm telegraf-config -o yaml
inputs section of the
telegraf-config ConfigMap defines all the endpoints of
Supervisor components from which Telegraf gathers metrics as well as the types of metrics themselves. For example the following input defines the Kubernetes API server as an endpoint :
 [[inputs.prometheus]]
      # APIserver
      ## An array of urls to scrape metrics from.
      alias = "kube_apiserver_metrics"
      urls = ["https://127.0.0.1:6443/metrics"]
      bearer_token = "/run/secrets/kubernetes.io/serviceaccount/token"
      # Dropping metrics as a part of short term solution to vStats integration 1MB metrics payload limit
      # Dropped Metrics:
      # apiserver_request_duration_seconds
      namepass = ["apiserver_request_total", "apiserver_current_inflight_requests", "apiserver_current_inqueue_requests", "etcd_object_counts", "apiserver_admission_webhook_admission_duration_seconds", "etcd_request_duration_seconds"]
      # "apiserver_request_duration_seconds" has _massive_ cardinality, temporarily turned off. If histogram, maybe filter the highest ones?
      # Similarly, maybe filters to _only_ allow error code related metrics through?
      ## Optional TLS Config
      tls_ca = "/run/secrets/kubernetes.io/serviceaccount/ca.crt"
The alias property indicates the component from where metrics are gathered. The namepass property specifies which component metrics are exposed and respectively collected by the Telegraf agents.
Although the telegraf-config ConfigMap already contains a broad range of metrics, you can still define additional ones. See Metrics For Kubernetes System Components and Kubernetes Metrics Reference.
Configure Observability Platform to Telegraf
In the outps section of telegraf-config you configure where Telegraf streams the metrics that it gathers. Several options exist such as outputs.file, outputs.wavefront, outputs.prometheus_client, and outps-https. The outps-https section is where you can configure the observability platforms that you want to use for aggregation and monitoring of the Supervisor metrics. You can configure Telegraf to send metrics to more than one platform. To edit the telegraf-config ConfigMap and configure an observability platform for viewing Supervisor metrics, follow the steps:
- Log in to the Supervisor control plane with an vCenter Single Sign-On administrator account.
kubectl vsphere login --server <control planе IP> --vsphere-username [email protected]
- Save the
telegraf-configConfigMap to the local kubectl folder:kubectl get cm telegraf-config -n vmware-system-monitoring -o jsonpath="{.data['telegraf\.conf']}">telegraf.confMake sure to store the
telegraf-configConfigMap in a version control system before you make any changes to it in case you want to restore to a previous version of the file. In case you want to restore to the default configuration, you can use the values from thedefault-telegraf-configConfigMap. - Add
outputs.httpsections with the connection settings of the observability platforms of your choice by using a text editor, such as VIM:vim telegraf.config
You can directly uncomment the following section and edit the values accordingly, or add a newoutputs.httpsections as needed.#[[outputs.http]] # alias = "prometheus_http_output" # url = "<PROMETHEUS_ENDPOINT>" # insecure_skip_verify = <PROMETHEUS_SKIP_INSECURE_VERIFY> # data_format = "prometheusremotewrite" # username = "<PROMETHEUS_USERNAME>" # password = "<PROMETHEUS_PASSWORD>" # <DEFAULT_HEADERS>For example, here's how anoutputs.httpconfiguration for Grafana looks like:[[outputs.http]] url = "http://<grafana-host>:<grafana-metrics-port>/<prom-metrics-push-path>" data_format = "influx" [outputs.http.headers] Authorization = "Bearer <grafana-bearer-token>"
See Stream metrics from Telegraf to Grafana for more information on configuring dashboards and consuming metrics from Telegraf.
And here's an example with VMware Aria Operations for Applications (former Wavefront):[[outputs.wavefront]] url = "http://<wavefront-proxy-host>:<wavefront-proxy-port>"The recommended way of ingesting metrics to Aria Operations for Applications is through a proxy. See Wavefront Proxies for more information.
- Replace the existing
telegraf-configfile on the Supervisor with the one that you edited on your local folder:kubectl create cm --from-file telegraf.conf -n vmware-system-monitoring telegraf-config --dry-run=client -o yaml | kubectl replace -f -
- Check if the new configuration is saved successfully:
- View the new telegraf-config ConfigMap:
kubectl -n vmware-system-monitoring get cm telegraf-config -o yaml
- Check if all the Telegraf pods are up and running:
kubectl -n vmware-system-monitoring get pods
- In case some of the Telegraf pods is not running, check the Telegraf logs for that pod to troubleshoot:
kubectl -n vmware-system-monitoring logs <telegraf-pod>
- View the new telegraf-config ConfigMap:
Example Operations for Applications Dashboards
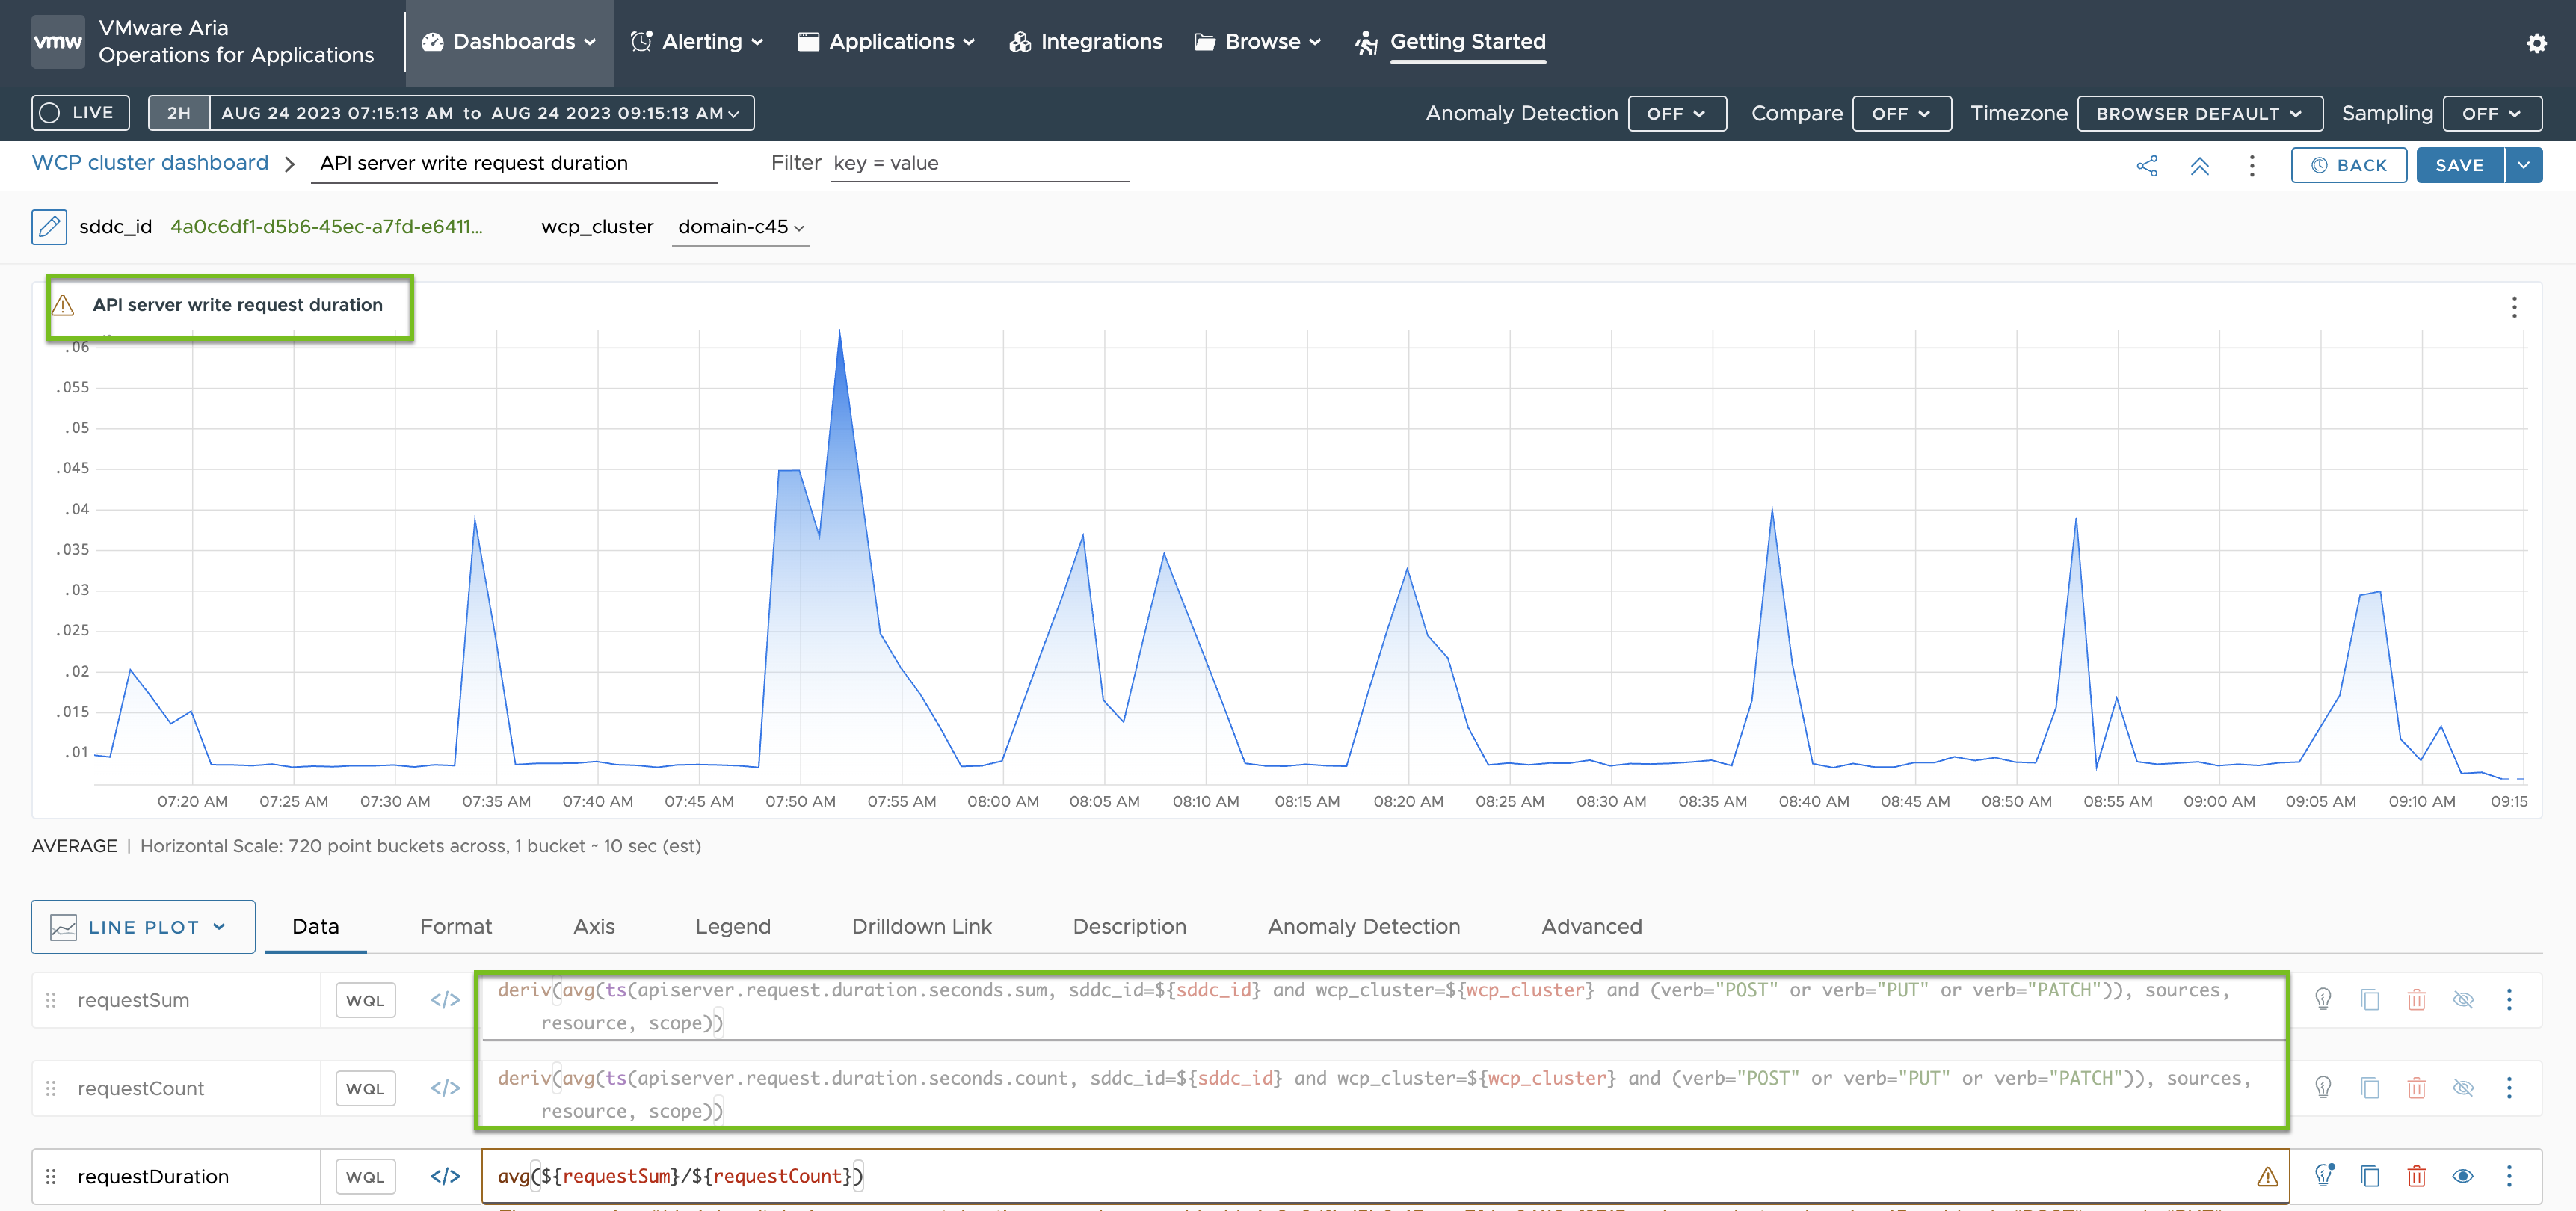
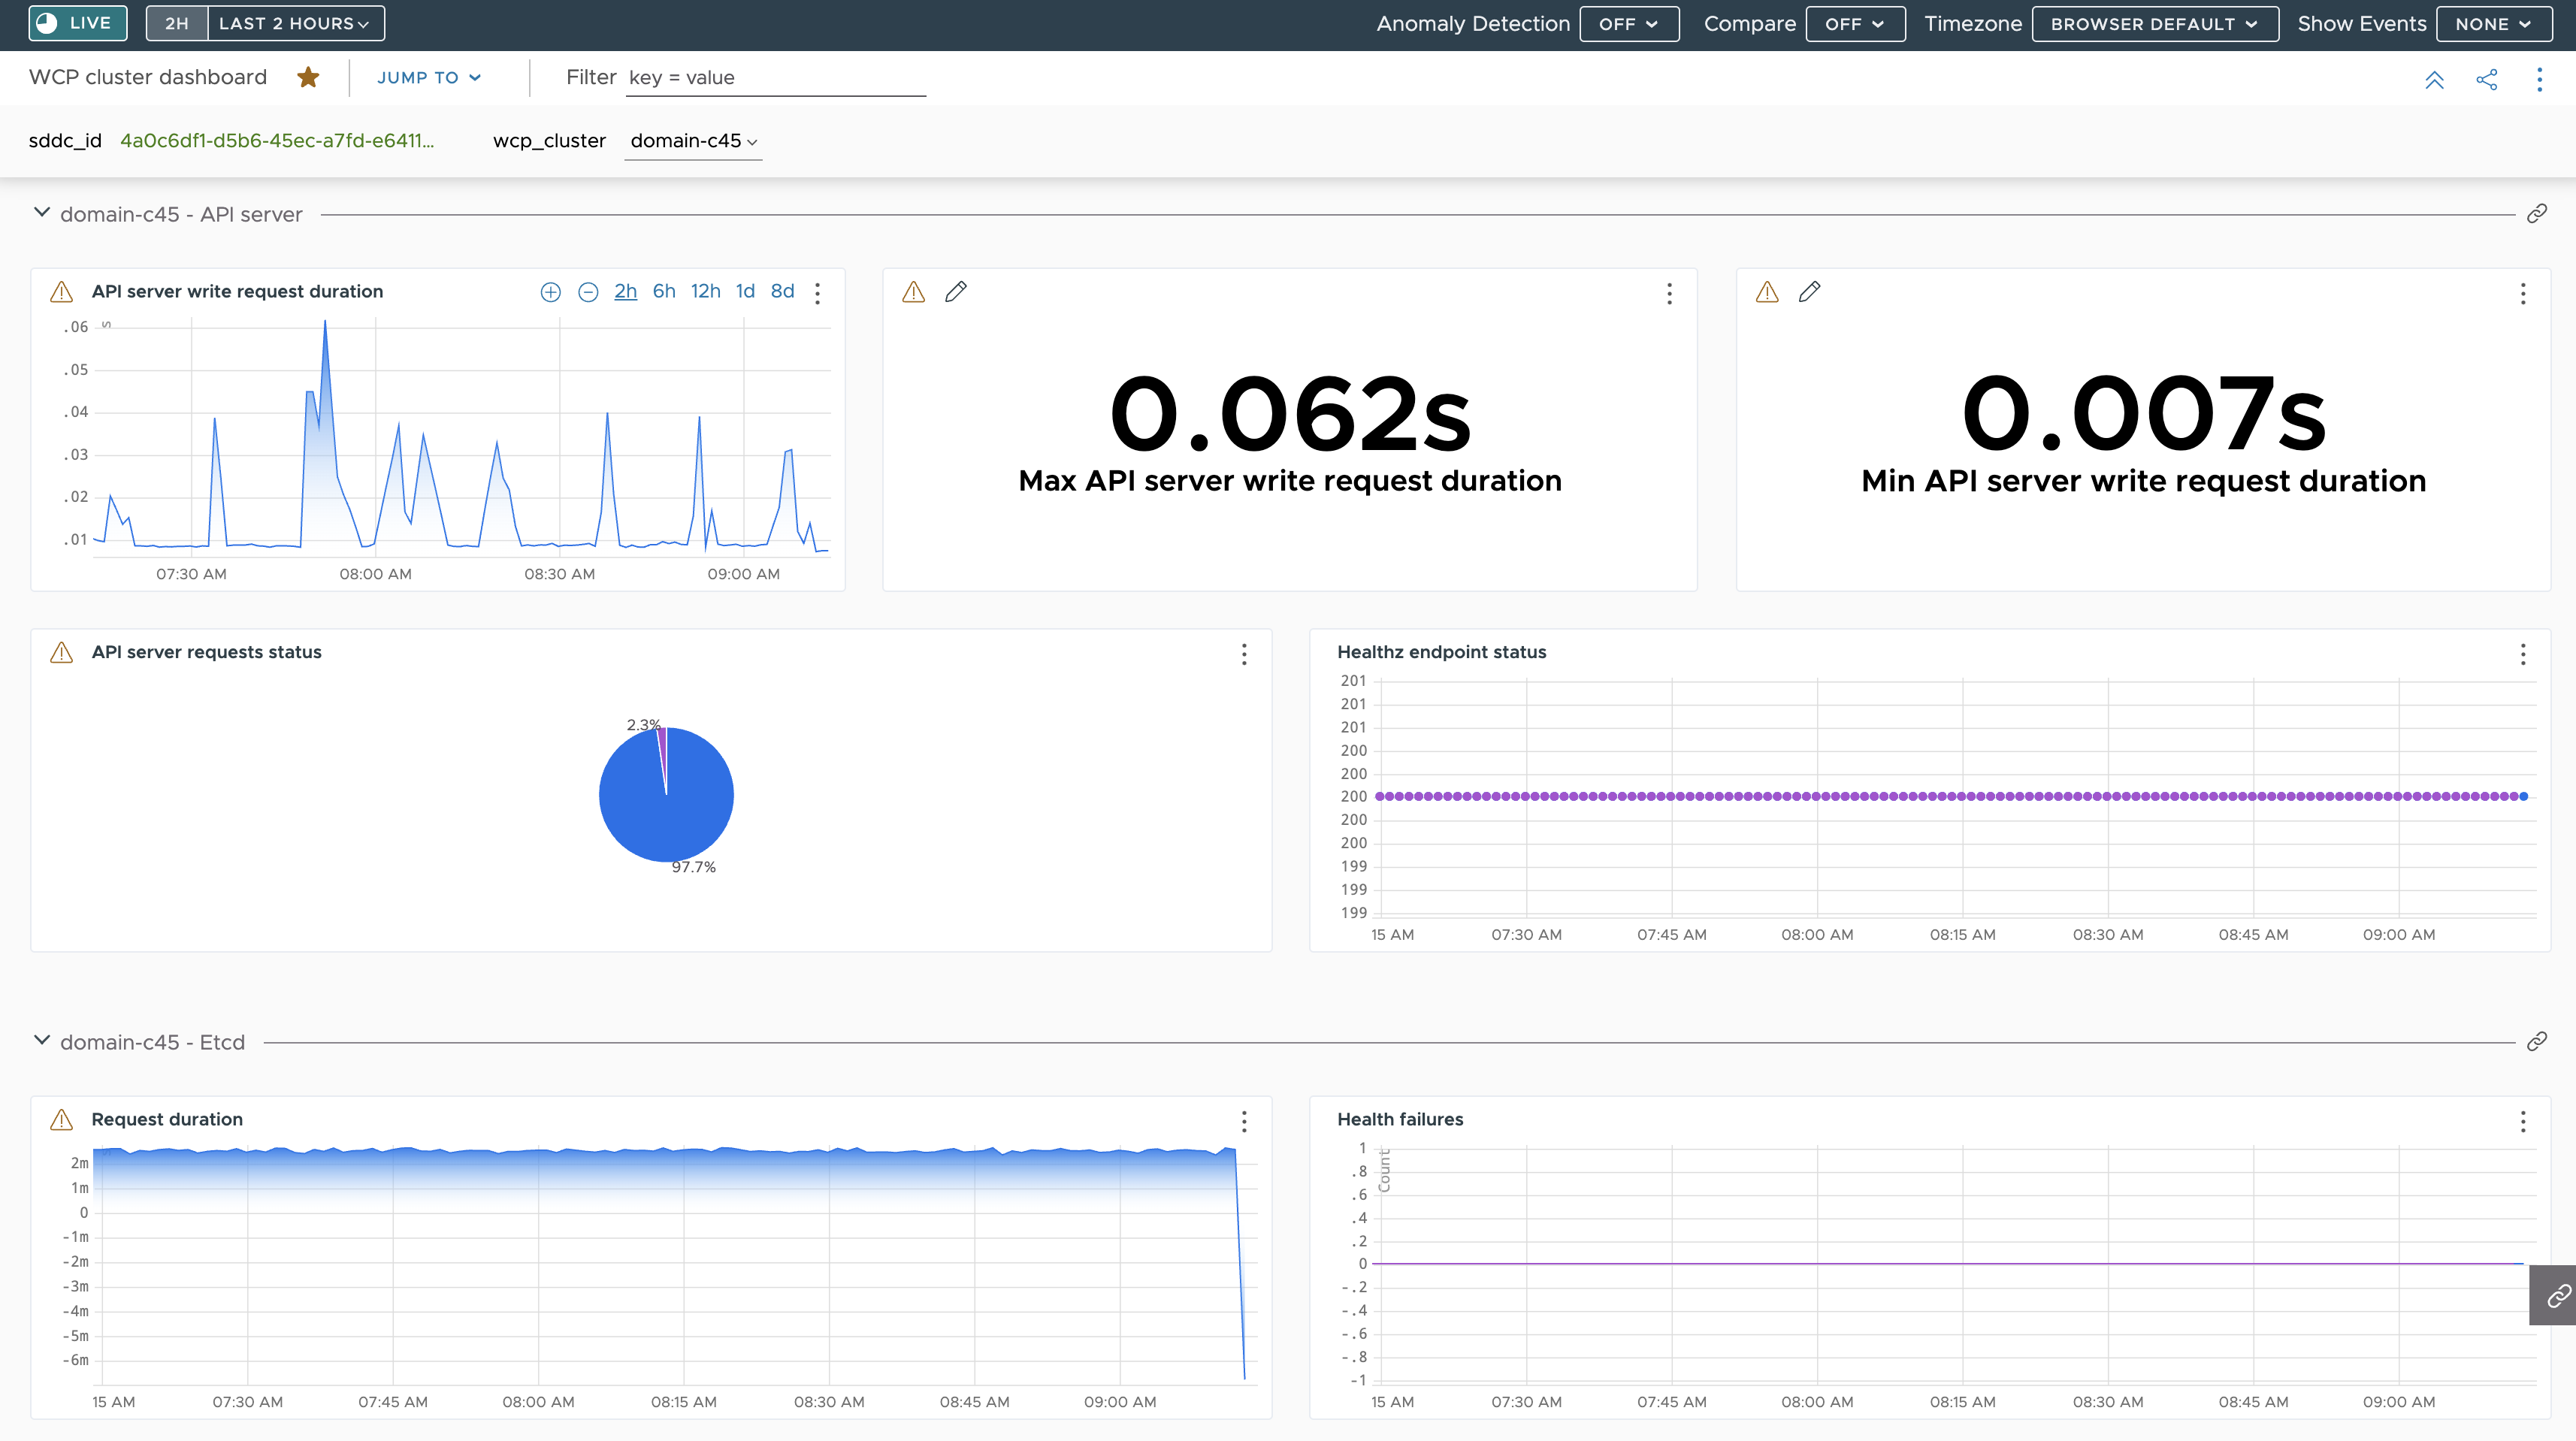
Following is a dashboard showing a summary for the metrics received from the API server and etcd on a Supervisor through Telegraf:
The metrics for the API server write request duration I based on the metrics that are specified in the telegraf-config ConfigMap as you can see highlighted in green: