In an integrated vRealize Automation and vRealize Operations Manager environment, you can access insights and alerts for vRealize Automation objects that are monitored by vRealize Operations Manager.
The Insights dashboard and Alerts tab pages provide the real-time capacity and related awareness information that you need to make management decisions in vRealize Automation without needing to open vRealize Operations Manager. The information is supplied by the associated vRealize Operations Manager application.
Working with the insights dashboard and with resource alerts
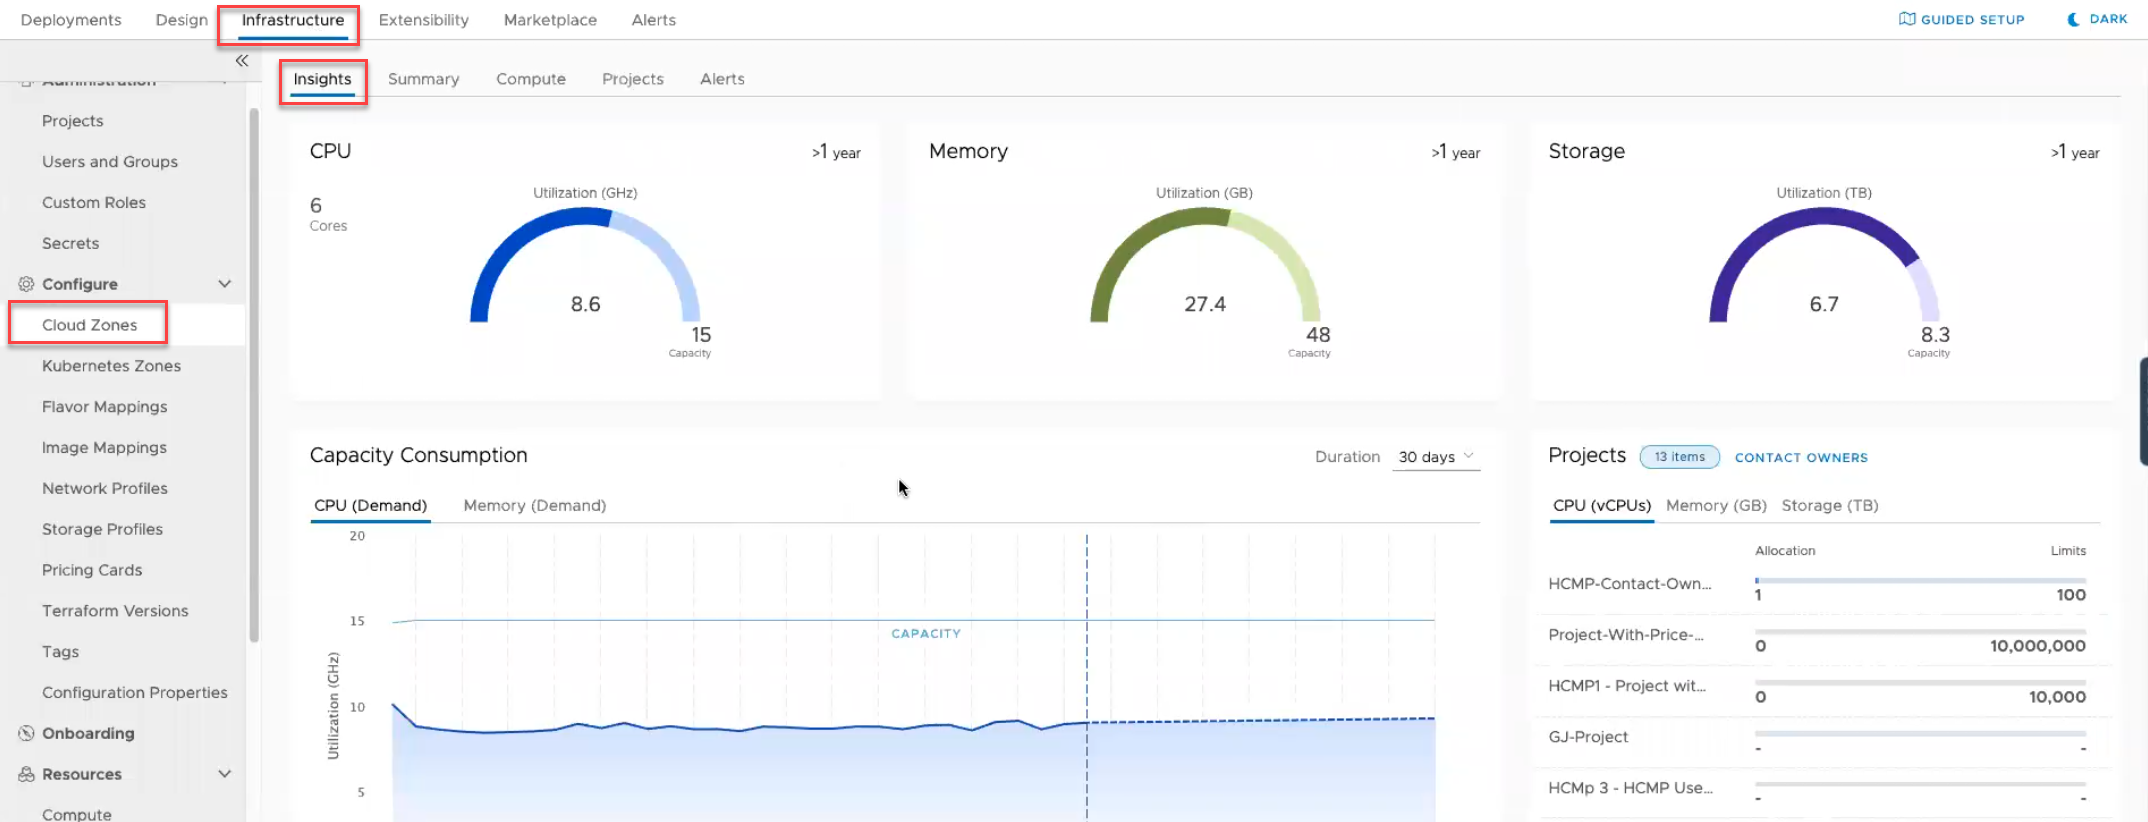
The Insights dashboard conveys information about capacity consumption across all computes within the cloud zone and grouped by projects. It can also show project deployments that are in need of optimization.
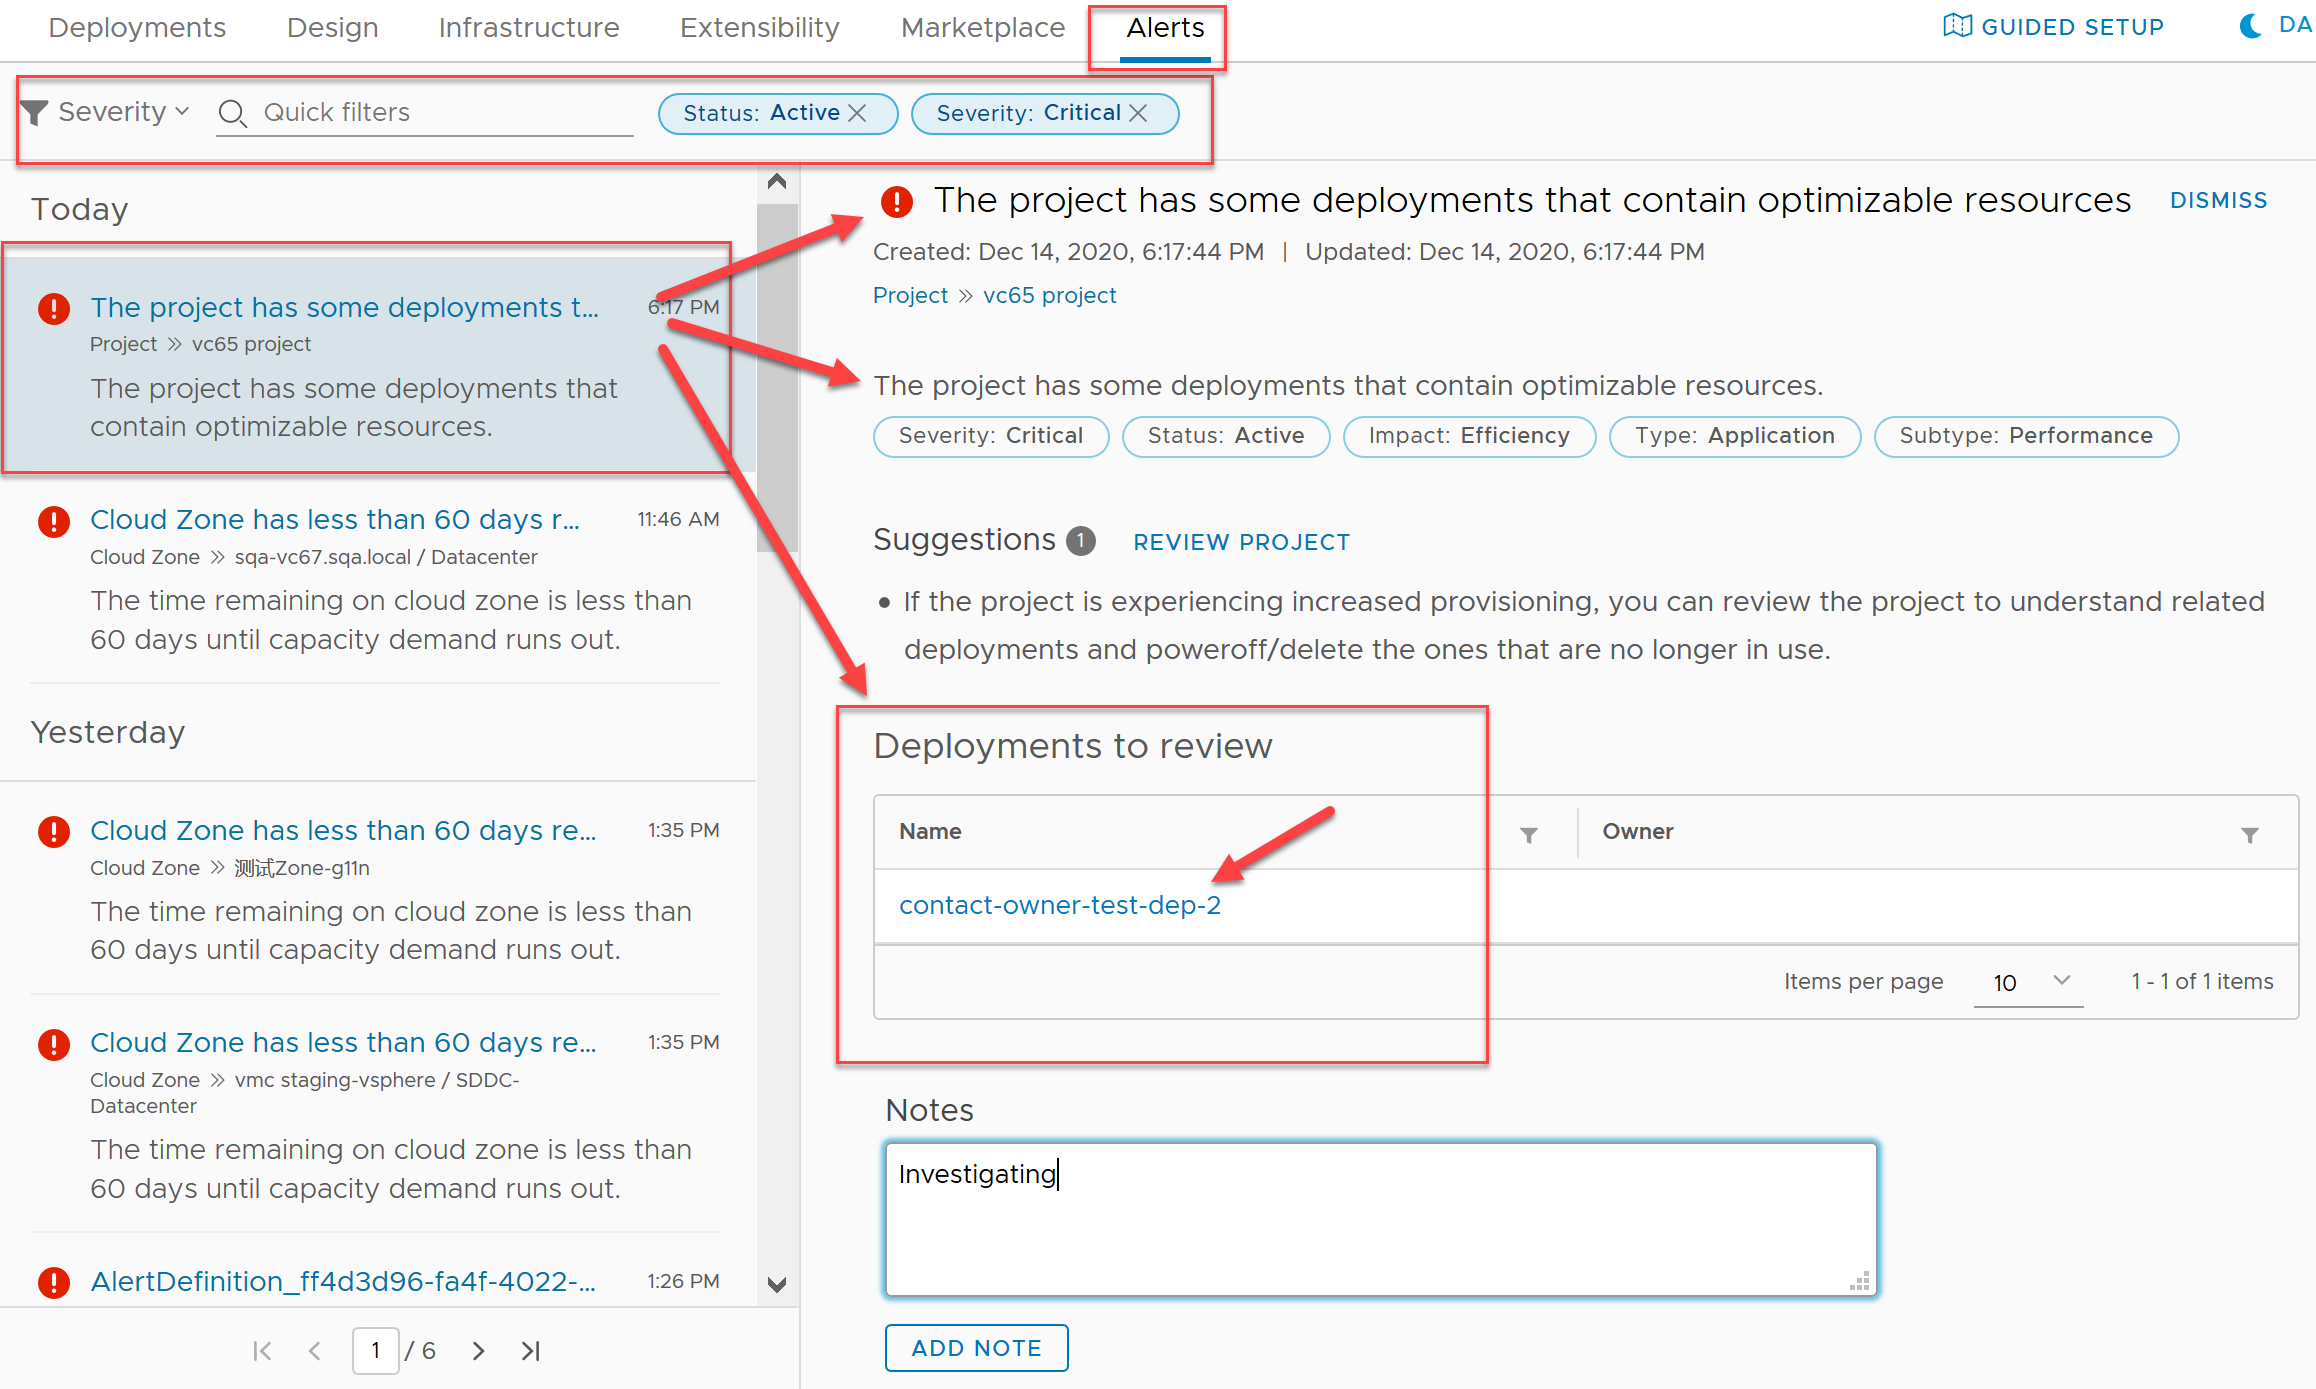
The Alerts pages displays potential capacity and performance concerns for objects such as cloud zones, projects, deployments, and virtual machines. They also contain information for project owners as to which of their deployments can be optimized. Each deployment link opens the Optimize tab in the deployment, where specific guidance is provided.
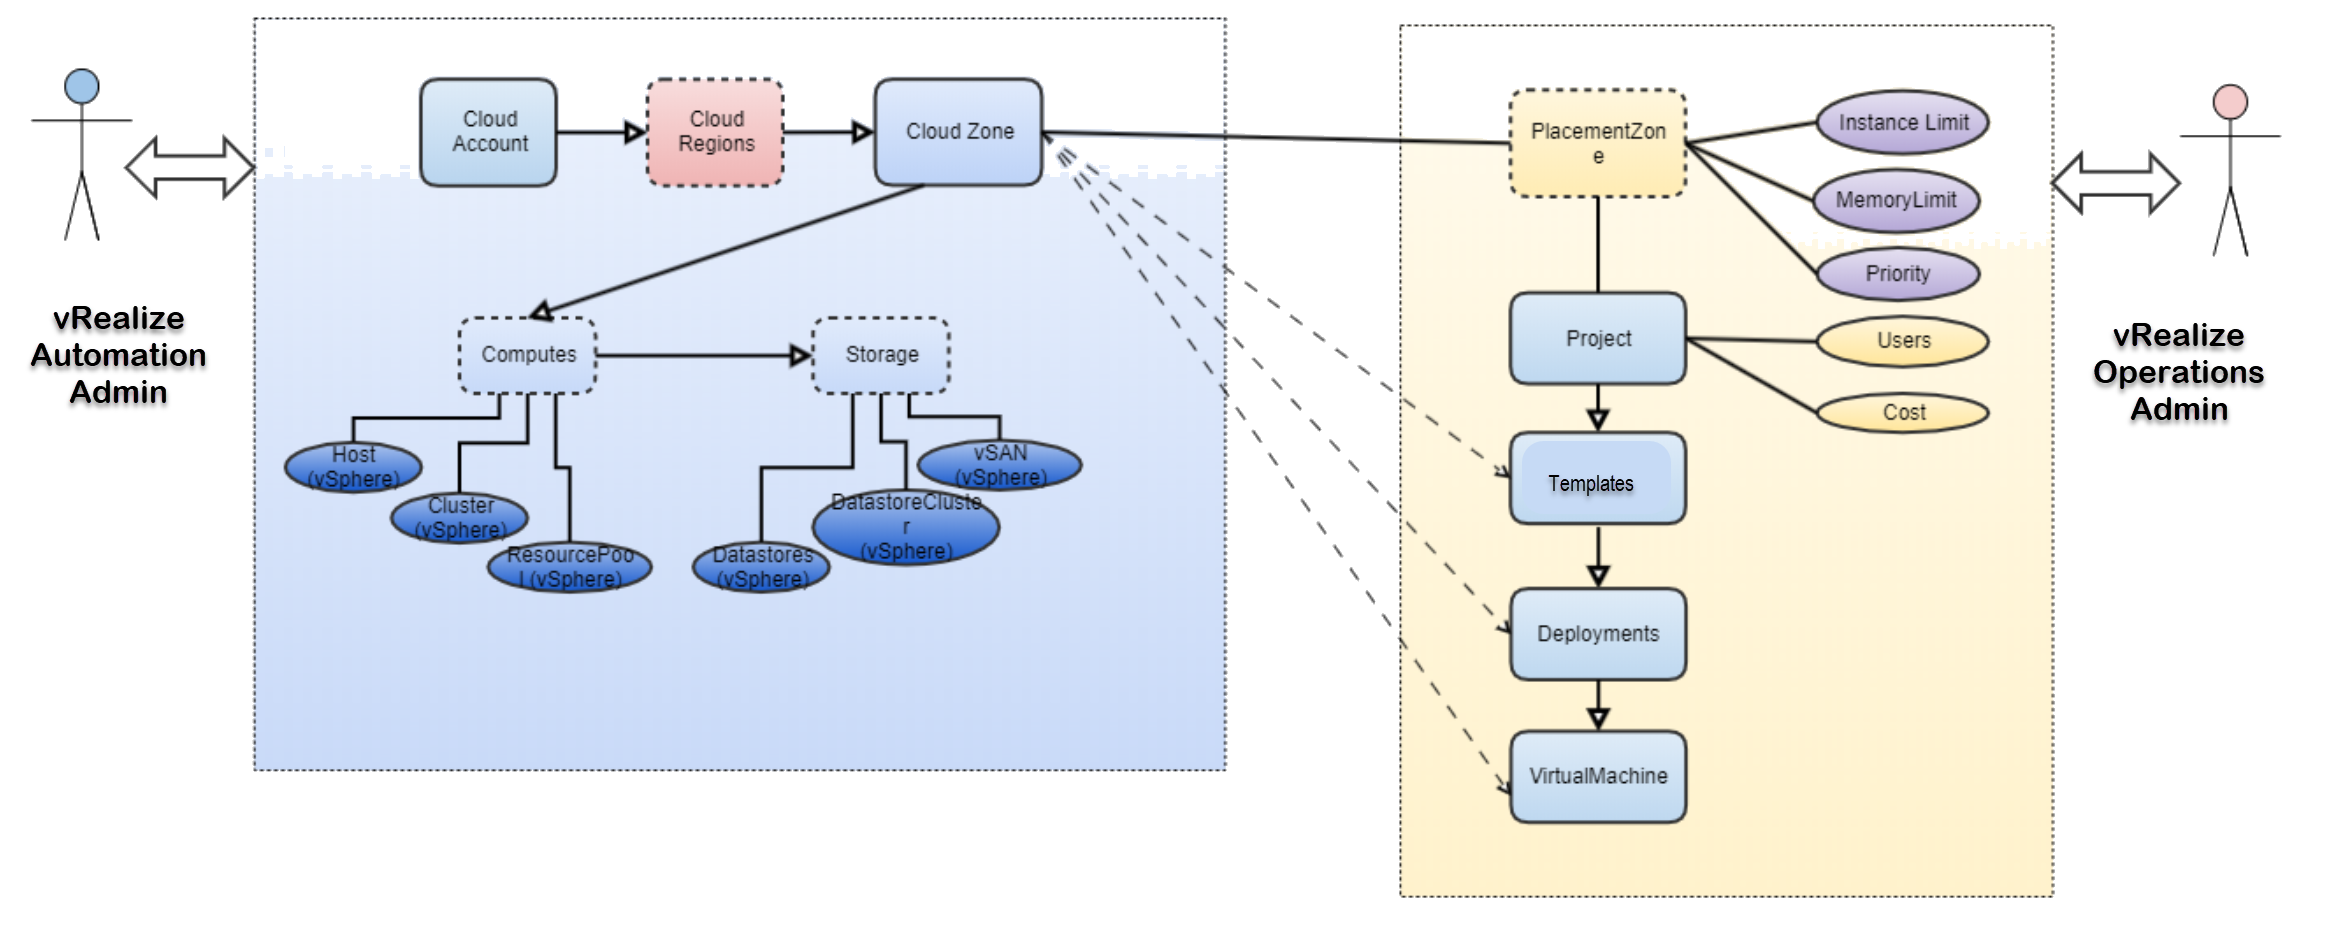
The following diagram illustrates the relationship between vRealize Automation resources and deployments, and the data that the associated vRealize Operations Manager application provides in vRealize Automation.

Working with the insights dashboard
- CPU, memory, and storage utilization usage as a percentage of capacity
- Capability consumption summary
- CPU and memory demand and usage history
- Consumption across projects
- Reclaimable resource capacity, with cost savings, for deployments and projects in a cloud zone

It also provides an option to alert project owners of deployments that can be optimized.
The Insights dashboard is available for vSphere and VMware Cloud on AWS cloud zones, provided that the cloud accounts are configured in both vRealize Automation and vRealize Operations Manager and are being monitored in vRealize Operations Manager.
For details, see: How to use the Insights dashboard to monitor resource capacity and notify project owners in vRealize Automation.
Working with alerts
- Severity
- Status
- Impact
- Type
- Subtype
- Resource
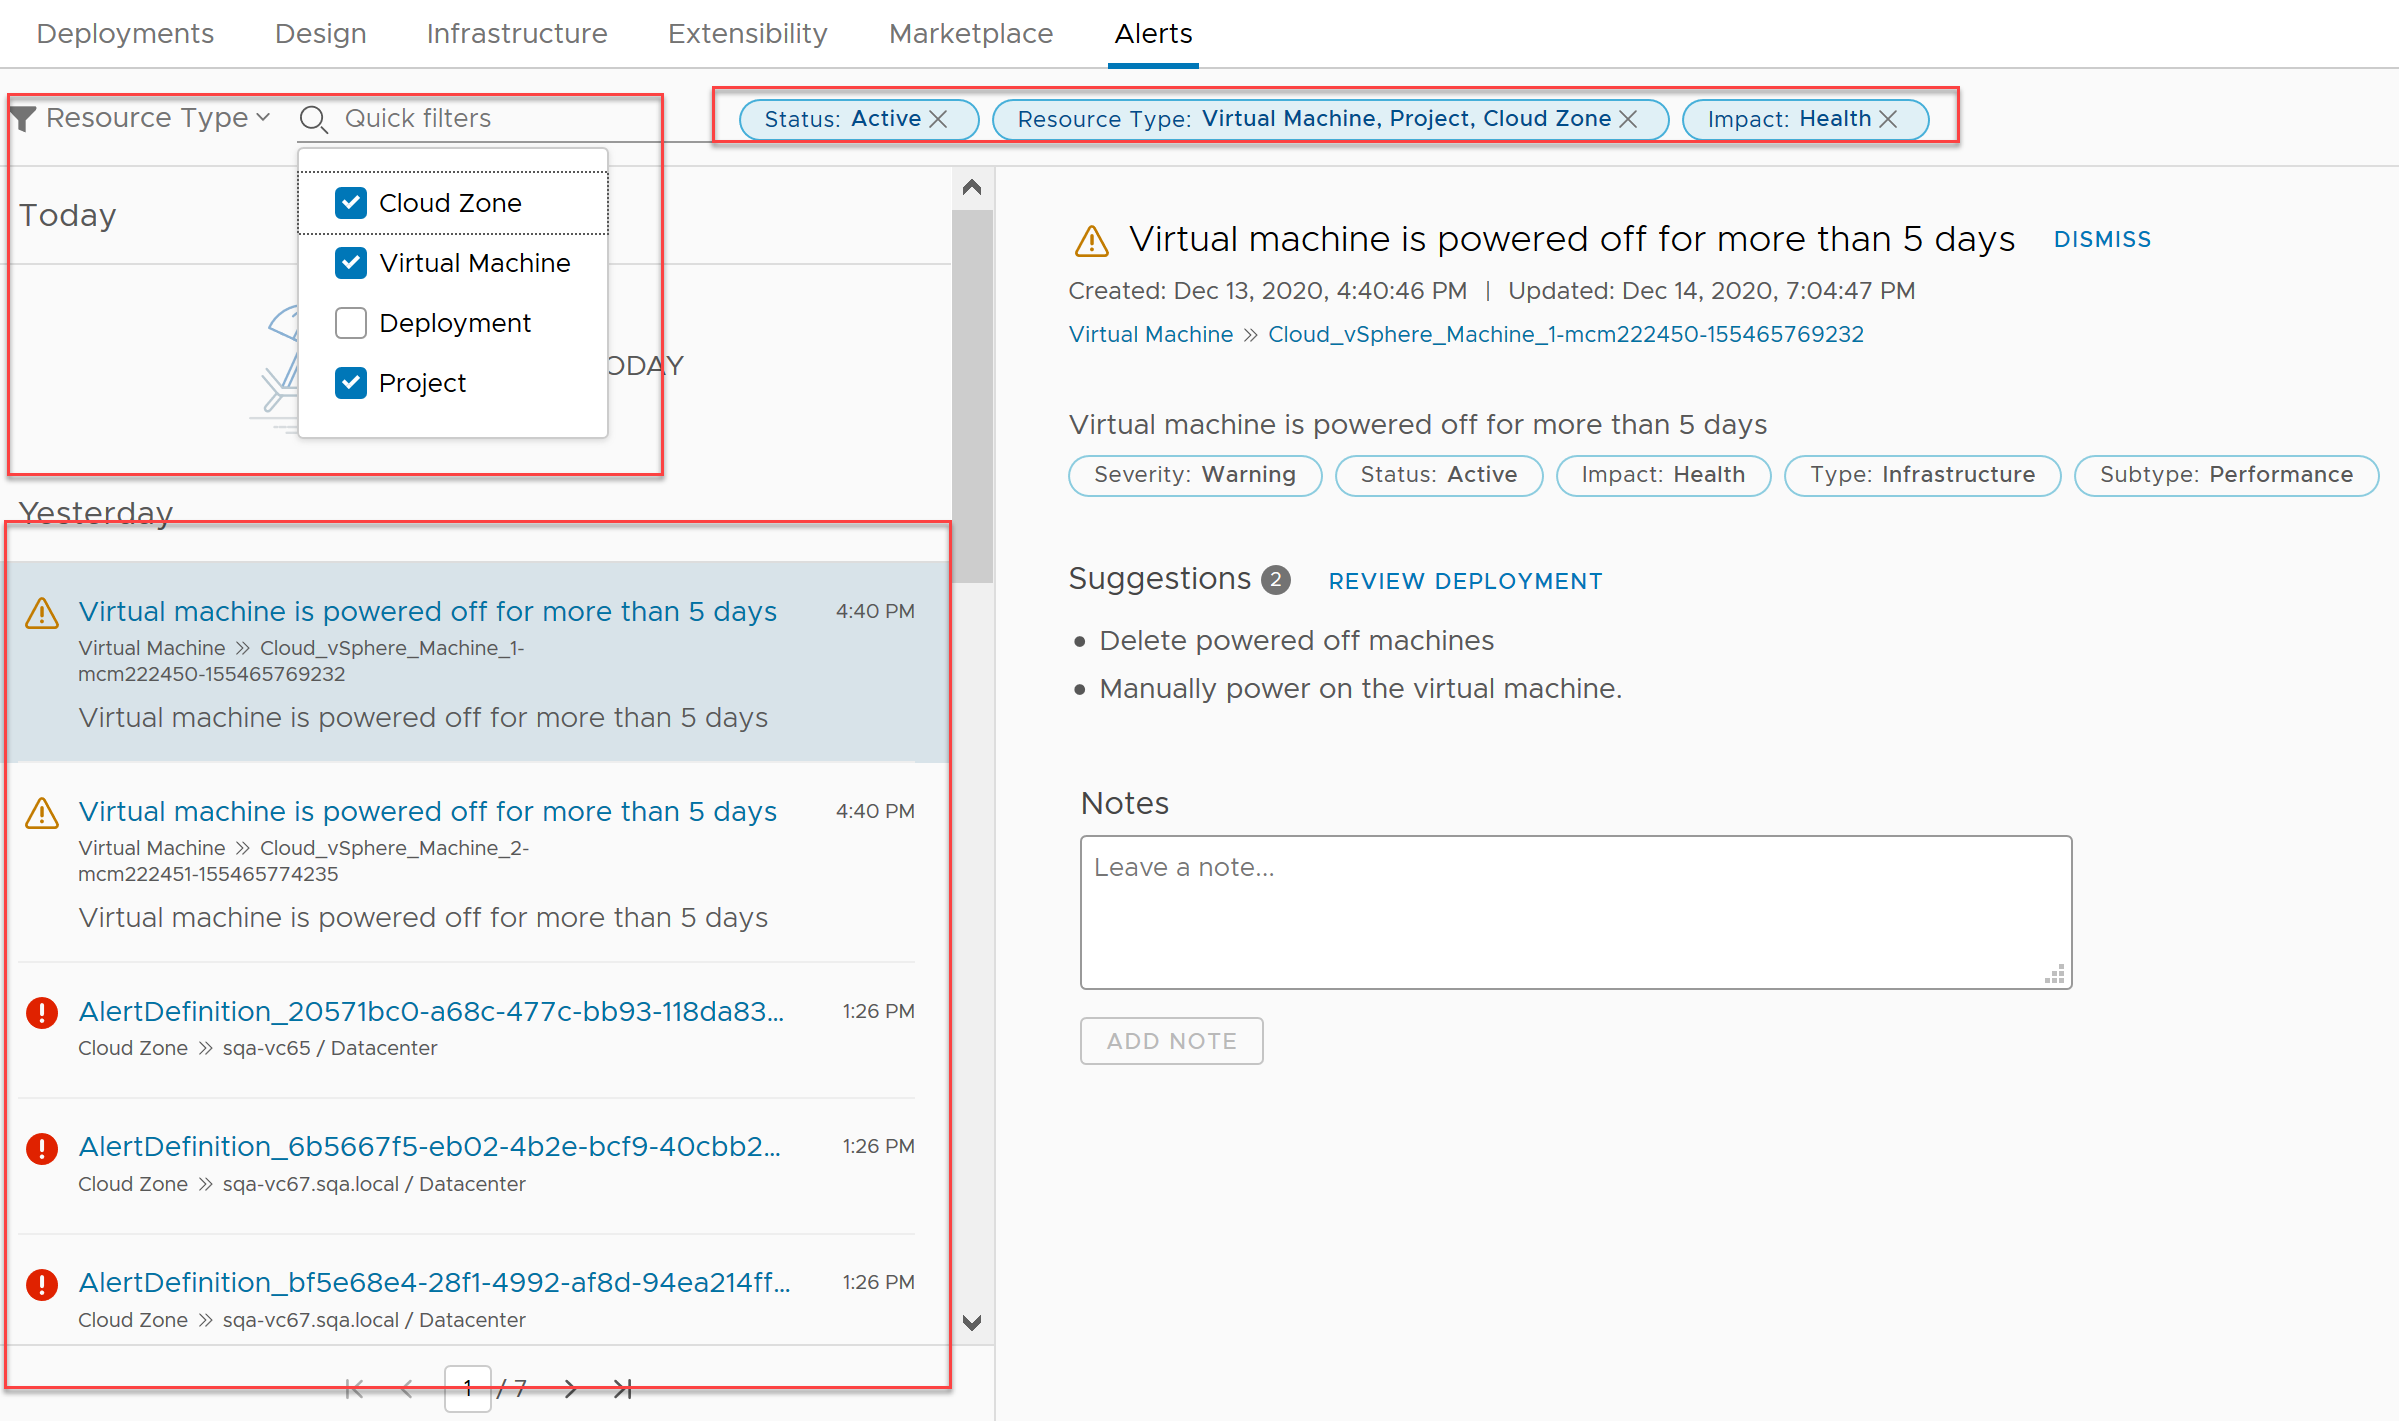
Each filter can be further refined using quick filters. For example, the resource filter can be further refined by its quick filter types of cloud zone, virtual machine, deployment, and project resource.
You use combinations of filters and quick filters to control which alerts are available for display.

Some Alerts provide information about, and a link to, deployments that can be optimized. An individual alert can provide the option to contact the project owner, examine an Insights dashboard, or take possible actions.

Alerts are available for vSphere and VMware Cloud on AWS resource objects.
For details about how to configure and use integrated alerts, see How to use Alerts to manage resource capacity, performance, and availability in vRealize Automation and How to use Alerts to optimize deployments in vRealize Automation.