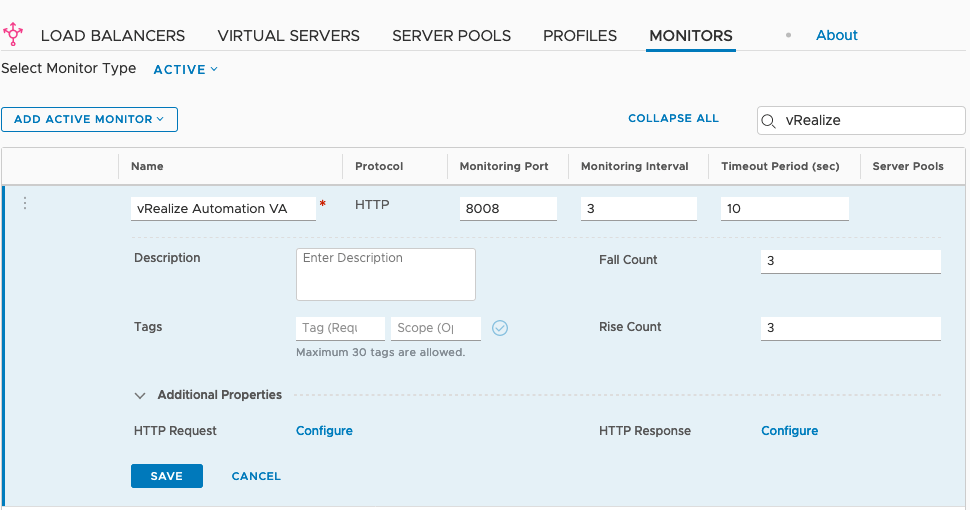
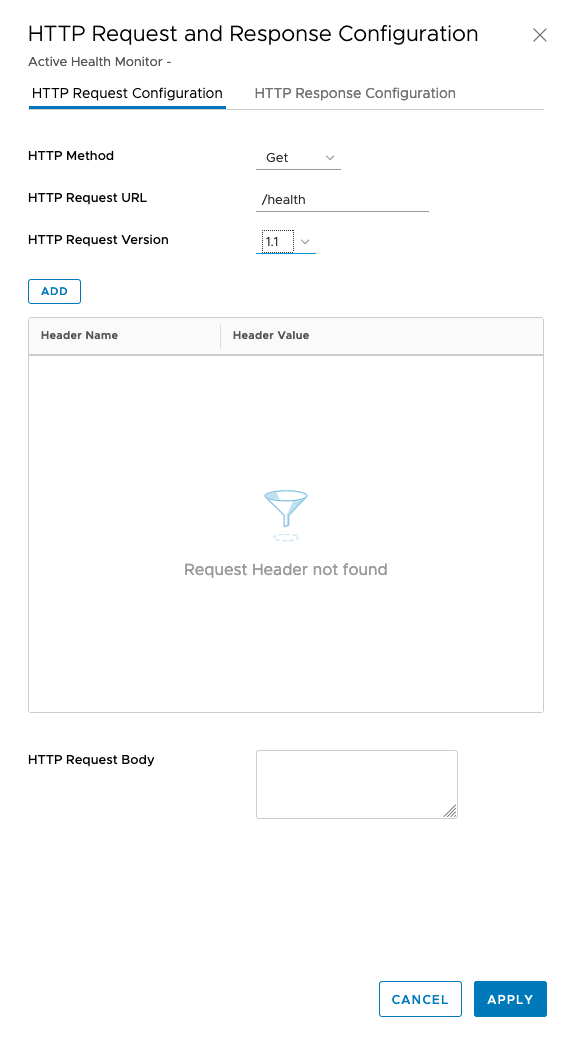
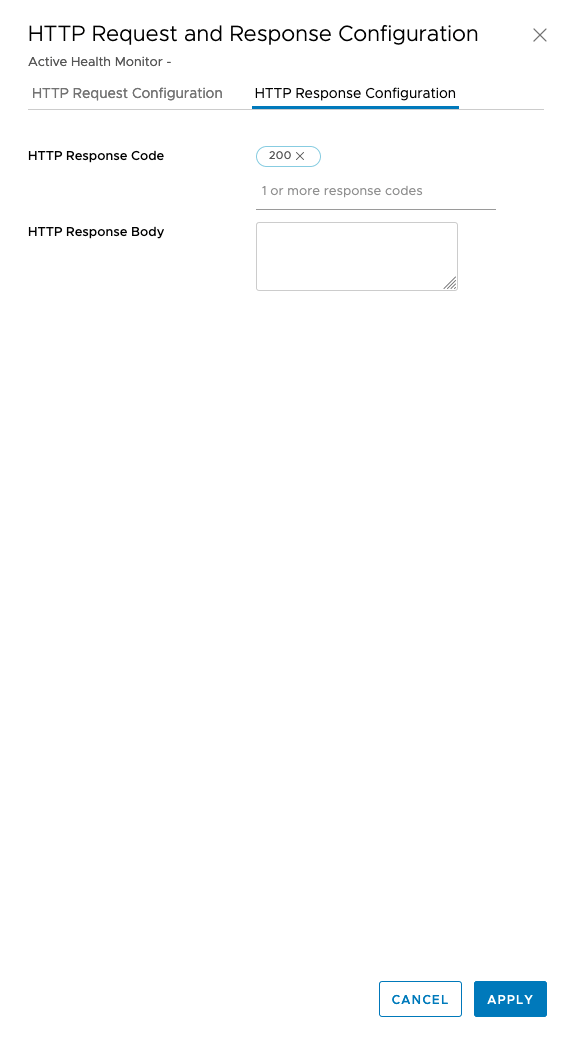
To configure an active health monitor for NSX-T follow these steps.

Procedure

  1. Navigate to Networking > Load Balancing > Monitors.
  2. Click Add Active Monitor and select HTTP.
  3. Enter a name for the health monitor.
  4. Configure the health monitor as outlined in this table:
    Table 1. Configure Health Monitor
    Name Monitoring Port Interval Timeout Fall Count Type Method URL Response Code Response Body
    vRealize Automation 8008 3 10 3 HTTP GET /health 200 None
    vRealize Orchestrator
    Note: Use only for external vRealize Orchestrator instances.
    8008 3 10 3 HTTP GET /health 200 None

Results

The completed configuration should look similar to these screens.