


Content packs are hosted in Log Insight and contain dashboards, extracted fields, saved queries, and alerts that are related to a specific product or set of logs. You can install community supported content packs from the VMware Sample Exchange and other content packs from the Content Pack Marketplace.
VMware vRealize Log Insight delivers automated log management through aggregation, analytics and search, enabling operational intelligence and enterprise-wide visibility in dynamic hybrid cloud environments. Content packs are plugins to VMware vRealize Log Insight that provide pre-defined knowledge about specific types of events such as log messages.
To download a content pack, from Log Insight navigate to . You can also import content packs by clicking + Import Content Pack.
vRA 8.x Content Pack
The VMware vRealize Automation content pack provides a consolidated summary of log events across all vRA environment components. In includes several dashboards that provide a general overview, insight on errors and operations, and overall health of your vRA instance. These dashboards are listed on the Dashboard tab along with all other Log Insight dashboards. Once loaded, it can take up to 30 seconds for the dashboards to populate with metrics.
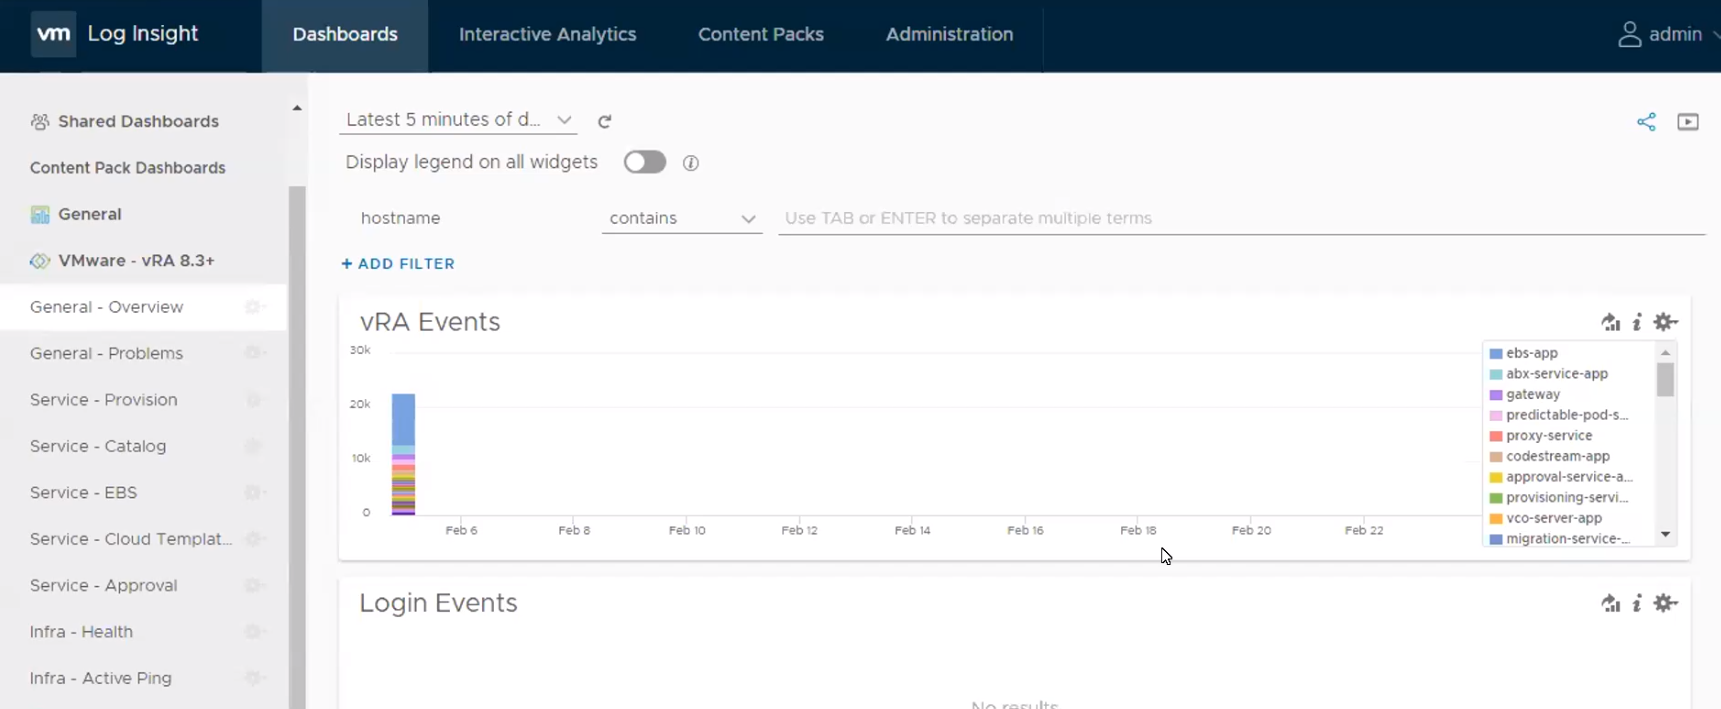
The vRealize Automation content pack includes these dashboards:
- General - Overview: Captures an overview of high level metrics for vRA.
- General - Problems:
- Service - Provision: Captures issues related to the provisioning service.
- Service - Catalog: Captures issues related to the catalog service.
- Service - EBS: Captures issues related to the event broker service.
- Service - Cloud Templates: Captures errors and metrics related to Cloud Assembly cloud templates, custom resources, and resource actions.
- Service - Approval: Captures errors and metrics related to approvals.
- Infra - Health: Captures when pods are restarted over time. This dashboard is essential to detect outages dues to resource limits.
- Infra - Active Ping: Captures the health check url over time.
Each dashboard contains individual widgets that provide more focused analytics. To view what type of analysis is performed in each widget, click the information  icon.
icon.
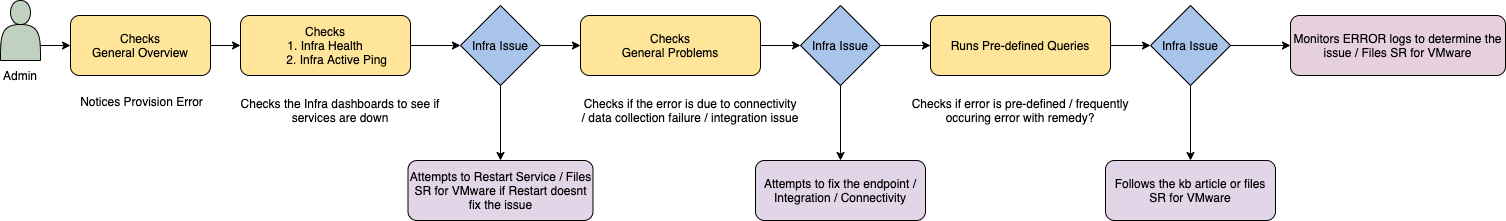
As a vRealize Automation administrator, you can follow this general content pack workflow to identify errors and troubleshoot.
For more information on the vRealize Automation 8.3 Content Pack, see vRealize Automation 8.3+ Log Insight Content Pack and How do I configure log forwarding to vRealize Log Insight.
