After completing configuration for health monitors, server pools, and virtual servers, verify the status of the configured environment and filter to the specific deployment that was just configured to get an overall view of the nodes, pools, and virtual servers.
You can verify the status of the components running on the load balancer and you can check the status of the pools from inside the UI of the vSphere Web Client.
Procedure
- Log in to the vSphere Web Client.
- Click Networking & Security and then click NSX Edges.
- Double-click an NSX Edge.
- Click Manage and then click the Load Balancer tab.
- In the left navigation panel, click Pools.
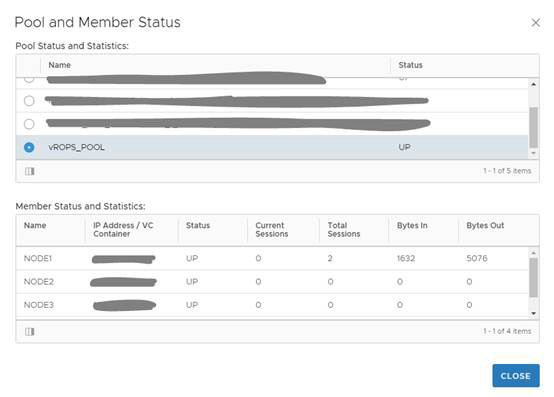
- Click Show Pool Status (
 ). A Pool and Member Status pop-up window appears.
 - Select a pool ID. For example: vROps_Pool.
Results
The member ID and status of the selected pool are displayed. The status can be UP or DOWN.
Example
Example: