


Operations Management is a set of interdependent disciplines. Knowing the relationship between these disciplines is as important as knowing each of them separately. The relationship between the disciplines matters because the symptom displayed and the root cause are often two different things, for example, sometimes a configuration problem can lead to a performance problem.
Availability
- Availability considers HA (high availability) settings. As a result, planned downtime (for example, ESXi on maintenance mode) impacts availability.
- Availability, done right, does not impact Capacity and Performance as it is already accounted for.
- The higher the Availability SLA, the higher the price. There is a significant difference for each additional 9 of availability. Five 9s costs a lot more than four 9s.
Performance and Capacity
- Performance is more time sensitive and important than capacity. You must manage performance first and then manage capacity.
- Performance and capacity have an opposite relationship. Highest performance is achieved at lowest capacity, as that is when the VM or the infrastructure is delivering the most amount of work.
- Capacity management is about maximizing utilization, without compromising any performance. It also considers latent workload and future demand.
Cost and Price
- Cost goes hand in hand with capacity. The higher the utilization of the IaaS, the lower the cost per VM. Cost is separate from capacity as it can be optimized without reducing capacity.
- Price can move independent of cost. It has concepts such as discount and progressive pricing. Use price to discourage large unused VMs.
- The better the performance SLA, the higher the price the customer is willing to pay, hence the term Price/Performance.
Compliance and Security
- Compliance is measured against both internal and industry standards.
- Security is related, but not the same as configuration.
Configuration and Inventory
- Inventory is related, but not identical to configuration. Configuration impacts performance, cost, capacity, and compliance. Therefore, it is the primary focus of optimization assessment. Inventory is what you have. Configuration includes properties of what you have. For example, the number of VMs in a cluster are a part of the inventory and not a part of configuration. The number of ESXi hosts in a cluster are a part of inventory and configuration because that is how the cluster is designed. The cluster is configured with eight ESXi hosts for the same reason.
There are two types of counters that impact performance and capacity. Contention is the primary counter for performance, and utilization is the primary counter for capacity. Utilization serves performance and capacity differently. For performance, look at the actual and real utilization. For capacity, it is measured against usable capacity (after HA and a buffer). While they have a negative correlation, contention can develop at low utilization. Unbalanced and configurations are two typical causes of low utilization. Allocation complements demand as newly provisioned VMs tend to be idle (which can last for months). Future load cannot be detected by the demand model as they do not exist. The allocation model should be used to complement the demand model.
The Seven Pillars of Operations Management and the Management Process
The best practice of operations management requires you to distinguish between the pillar and process. The pillar is what you must manage, and the process is how you manage them. 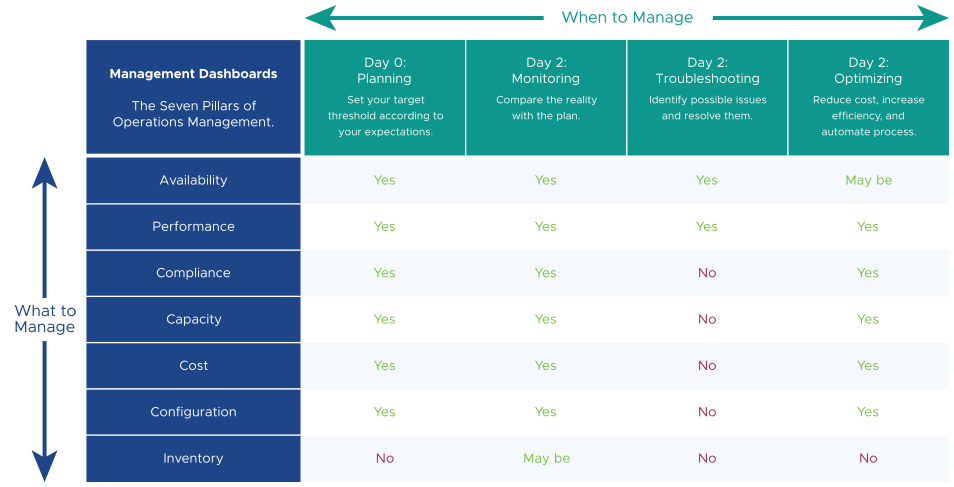
Each pillar is an individual unit of management, namely capacity management, performance management, and compliance management. They represent individual disciplines and are compatible with one another. Each pillar's complexity depends on the technology, for example, vSAN's capacity is more dynamic than the central array. In vSAN, changing the storage policy can create a sudden spike.
Day 0 provides the expected result. Some companies conduct a stress test, load test, so they know what to expect when the real load comes in. Without proper planning, you cannot know what the reality is, as you have not defined the process well.
Troubleshooting is an activity and not something you manage. It focuses on the reason, and then formulates a solution to prevent future incidents. Incidents either mean something dead, slow, or breached. You troubleshoot availability, performance, and security.
Inventory is something you have, not something you plan. You plan for capacity, with a certain configuration. Inventory merely accounts for what you have. Nothing to troubleshoot nor optimize.
Using the Getting Started Page
The Getting Started page breaks tasks into broad three broad categories, Management, Flows, and Collections. Use the Getting Started Dashboard to understand the relationship between these categories.
The Management category includes the seven pillars of operations, Availability, Performance, Compliance, Capacity, Cost, Configuration, and Inventory.
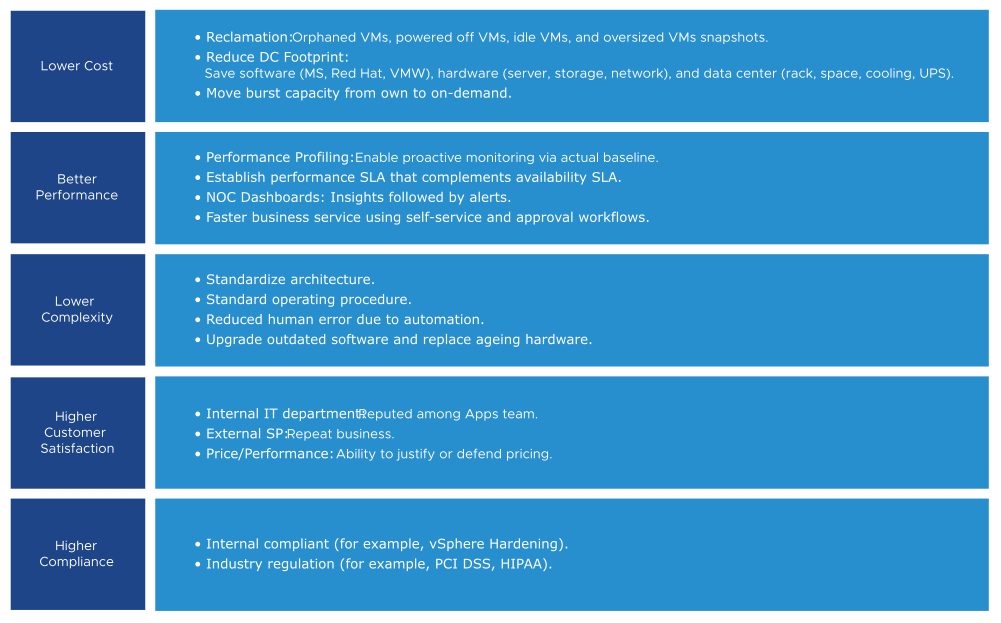
The Flows category of dashboards covers the process that includes Troubleshooting, Optimization, and Optimize Cost. You can use the Troubleshooting dashboards to resolve any potential issues related to availability, contention, utilization, and configuration. Troubleshooting is more than simply identifying the problem. It focuses on the reason behind the problem and also formulates a solution to prevent reoccurrence. An incident means that something is either dead, slow, or has been breached. You can troubleshoot availability, performance, and capacity. Use the Optimization dashboards to enhance the performance of your environment. You can choose to correct a problem area, update, simplify, or improve your virtual machines and infrastructure. You can optimize performance, capacity, cost, and configuration. You even improve the availability of your system to an extent but you cannot enhance the compliance or inventory. The Optimization Cost dashboard helps you to improve the cost efficiency of your environment. With the Optimization Cost dashboard you get an overview of the cost, potential savings, actionable recommendations, and you can quantify the realized savings based on the recommendations for your environment.
The Collection category comprises of Public Cloud and the Library sections. The AWS and Azure dashboards are displayed under the Public Cloud dashboards. You can choose to view the overall performance of these services or view specific dashboards related to the services. The Library contains dashboards related to the Network Operating Center and the Executive. It also lists dashboards that do not fit into the pillars of operation, like the VOA and the deprecated dashboards.
