


Performance is about ensuring workloads get the necessary resources. Key Performance Indicators (KPI) can be used to identify performance problems related to workloads. Use these KPIs to define SLAs associated with tiers of service. These dashboards use KPIs to display the performance of workloads at the consumer layer and the aggregate performance of workloads at the provider layer.
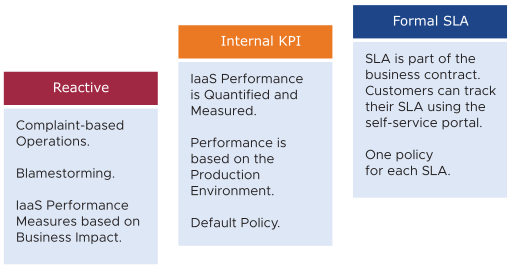
SLA is the formal business contract that you have with your customers. Typically, SLA is between the IaaS provider (the infrastructure team) and the IaaS customer (the application team or business unit). Formal SLA needs operational transformation, for example, it requires more than technical changes and you might need to look at the contract, price (not cost), process, and people. KPI covers SLA metrics and additional metrics that provide early warning. If you do not have an SLA, then start with Internal KPI. You must understand and profile the actual performance of your IaaS. Use the default settings in vRealize Operations if you do not have your own threshold, as those thresholds have been selected to support proactive operations.
The Three Processes of Performance Management
- Planning. Set your performance goals. When you architect a vSAN, you must know how many milliseconds of disk latency you want. 10 milliseconds measured at the VM level (not the vSAN level) is a good start.
- Monitoring. Compare the plan with the actual. Does the reality match what your architecture was supposed to deliver? If not, you must fix it.
- Troubleshooting. When the reality is not according to the plan, you must fix it proactively and not wait for issues and complaints.
- Contention: This is the primary indicator.
- Configuration: Check the version incompatibilities.
- Availability: Check for soft errors. vMotion stun time, lock up. This requires Log Insight.
- Utilization: Check this in the end. If the first three parameters are good, you can skip this.
The Three Layers of Performance Management
There are three main realms of enterprise applications. Each of these realms has its own set of teams. Each team has a set of unique responsibilities and requires the associated skill set. The three realms comprise of Business, Application, and IaaS. Refer to the graphic below to understand the three layers and the typical questions asked on each layer. 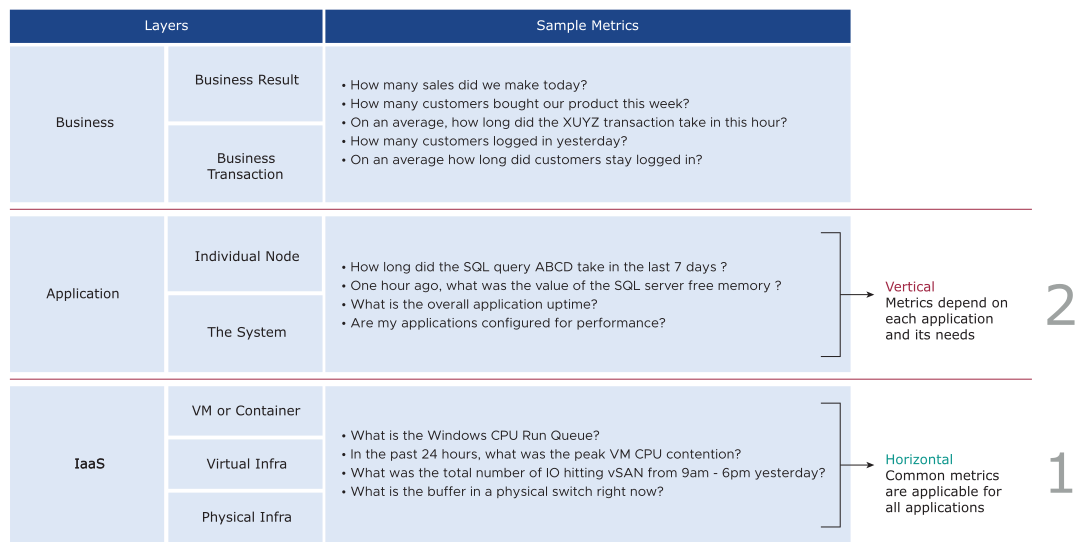
Performance Management is largely an exercise in elimination. The methodology slices each layer and determines if that layer is causing the performance problem. Hence it is imperative to have a single metric to indicate if a particular layer is performing or not. This primary metric is aptly named Key Performance Indicator (KPI).
The upper layer depends on the layer below it, and hence the infrastructure layer is typically the source of contention. As a result, focus on the bottom layer first, as it serves as the foundation for the layer above it. The good part is this layer is typically a horizontal layer, providing a set of generic infrastructure services, regardless of what business applications are running on it.
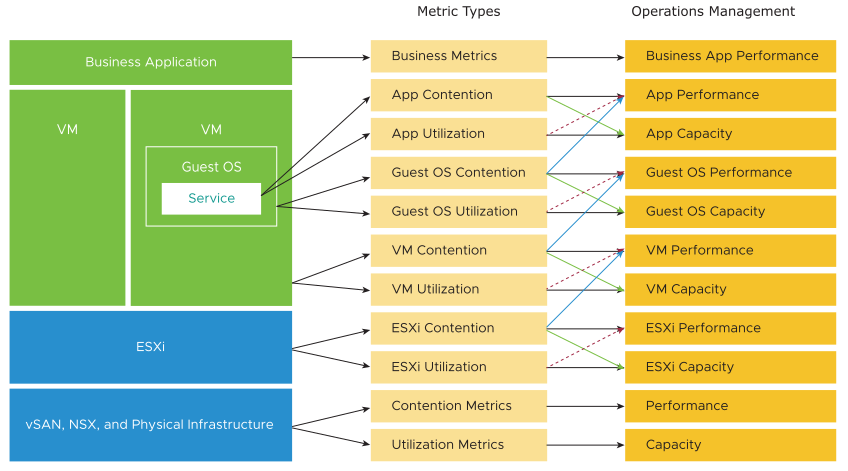
The Two Metrics of Performance Management
The primary counter for performance is contention. Most look at utilization, because they fear something wrong might happen if utilization is high. That something is contention. Contention manifests in different forms like, queue, latency, dropped, canceled, and context switch.
However, do not confuse ultra-high utilization indicators as a performance problem. If your ESXi host experiences ballooning, compression, and swapping, it does not mean that your VM has a performance problem. You measure the performance of the host by how well it serves its VMs. While performance is related to the ESXi host utilization, the performance metric is not based on the utilization, instead it is based on contention metrics.
| Infra Configuration | VM and Guest OS Configuration |
|---|---|
ESXi Settings
|
VM: Limit, Share, and Reservation
|
Network
|
Size: NUMA effect. VM spanning NUMA nodes. |
Cluster Settings
|
Snapshot. IO is processes 2x. VM drivers. |
vSAN
|
Windows or Linux process ping pong, process runaway, and OS level queue. |
From the performance management point of view, the vSphere cluster is the smallest logical building block of the resources. While the resource pool and VM Host affinity can provide a smaller slice, they are operationally complex, and they cannot deliver the promised quality of IaaS service. Resource pool cannot provide a differentiated class of service. For example, your SLA states that gold is two times faster than silver because it is charged at 200% more. The resource pool can give gold two times more shares. Whether those extra shares translate into half the CPU readiness cannot be determined up front.
VM Performance
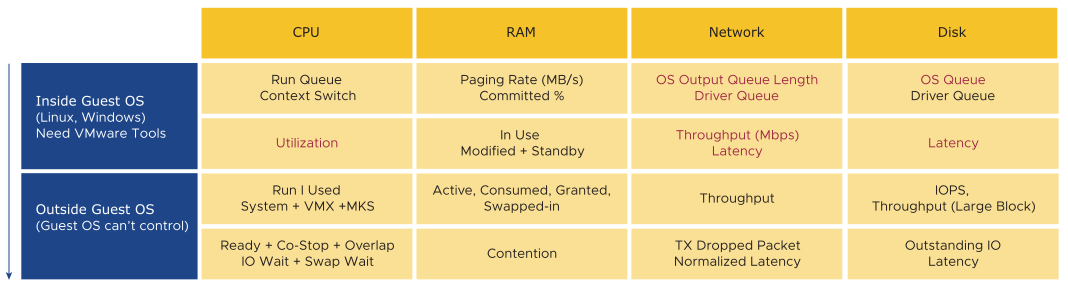
The KPI counters can get technical for some users, so vRealize Operations include a starting line to get them started. You can adjust the threshold, once you profile your environment. This profiling is a good exercise, as most customers do not have a baseline.The profiling requires an advanced edition.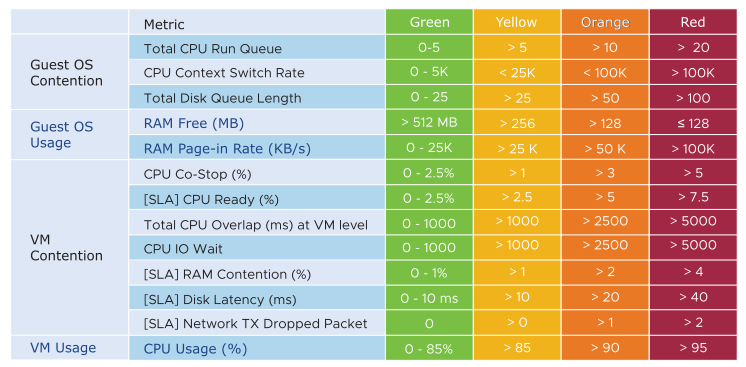
Performance Metrics
| IaaS | VM Counter | Threshold |
|---|---|---|
| CPU | Ready | 2.5% |
| RAM | Contention | 1% |
| Disk | Latency | 10 ms |
| Network | TX Dropped Packet | 0 |
The table is an example of a stringent threshold. A high standard for performance is used because it is an internal KPI for the consumption of the infrastructure team. It is not an external formal SLA that is confirmed with the customers. There must be a buffer between the internal KPI and the external SLA so that the operations team receive early warnings and has the time to react before the external SLA is breached. A high standard also works from the mission critical point to view to the development environment. If the standard is set to the least performing environment, then it cannot be applied to the more critical development.
A single threshold is used to keep the operations simple. This means that the performance in production is expected to have a higher score than the development environment. The development environment performance is expected to be worse than the production environment, while everything else is equal. A single threshold helps to explain the difference in Quality of Service (QoS) provided by a different class of service. For example, if you pay less, you get a poor performance and if you pay half the price, expect to get half the performance.
The four elements of IaaS (CPU, RAM, Disk, and Network) as mentioned in the table, are evaluated on every collection cycle. The collection time is set at five minutes as it is an appropriate balance for monitoring. If SLA is based on one minute, it is too close and results in either cost increase or reduction in threshold.
Design Considerations
All the performance dashboards share the same design principles. They are intentionally designed to be similar, as it is confusing if each dashboard looks different from one another, considering they have the same objective.
The dashboards are designed with separate two sections: summary and detail.
- The summary section is typically placed at the top of the dashboard to provide the overall picture.
- The detail section is placed below the summary section. It lets you drill down into a specific object. For example, you can get the detailed performance report of any specific VM.
In the detail section, use the quick context switch to check the performance of multiple objects during performance troubleshooting. For example, if you are looking at the VM performance, you can view the VM-specific information and the KPIs without changing screens. You can move from one VM to another and view the details without opening multiple windows.
The dashboard uses progressive disclosure to minimize information overload and ensure the webpage loads fast. Also, if your browser session remains, the interface remembers your last selections.
Many of the performance and capacity dashboards share a similar layout since there is a shared commonality between these pillars of operations.
