


The Metric Picker widget displays a list of available metrics for a selected object.
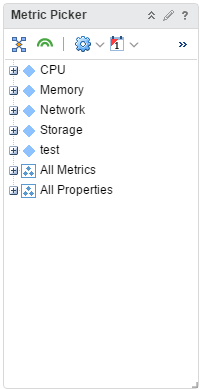
How the Metric Picker Widget and Configuration Options Work
With the Metric Picker widget, you can check the list of the object's metrics. To select an object to pick its metrics, you use another widget as a source of data, for example, Topology Graph widget. To set a source widget that is on the same dashboard, you use the Widget Interactions menu when you edit a dashboard. To set a source widget that is on another dashboard, use the Dashboard Navigation menu when you edit a dashboard that contains the source widget. You can also search for objects using tags.
You edit a Metric Picker widget after you add it to a dashboard. The changes you make to the options create a custom chart to meet the needs of the dashboard users.
Where You Find the Metric Picker Widget
The widget might be included on any of your custom dashboards. From the left menu, click to see your configured dashboards.
To customize the data that appears in the dashboard widget, from the left menu, click . To create your dashboard, from the left menu, click . From the Dashboards panel, click Create. To edit your dashboard, from the left menu, click . From the Dashboards panel, select the dashboard you want to edit and select . Toggle between the Views and Widgets option to view and add a widget or view to the dashboard. The widgets list panel displays a list of all the predefined widgets. Drag a widget to the dashboard workspace in the upper panel.
Metric Picker Widget Toolbar Options
On the title bar of the widget, click the Show Toolbar icon to access the toolbar options.
The toolbar contains icons that you can use to change the view of the graphs.
| Option | Description |
|---|---|
| Show common metrics | Filter based on common metrics. |
| Show collecting metrics | Filter based on collecting metrics. |
| Metrics or Properties | Filter based on metrics or property metrics. |
| Time Range | Filter based on selected time range. |
| Search | Search for dashboards, views, and network IP addresses using tags. |
Metric Picker Widget Configuration Options
On the title bar of the widget, click the Edit Widget icon to configure the widget.
The configuration options are grouped into one or more sections. You can select the objects on which you want to base the widget data and refine the objects in the following sections. Each section filters the objects further and pushes the filtered objects to the next section. The widget data is based on the objects that are the output of the last section.
The Configuration section provides general configuration options for the widget.
| Option | Action |
|---|---|
| Title | Enter a custom title that identifies this widget from other instances that are based on the same widget template. |
| Configuration | |
| Refresh Content | Activate or deactivate the automatic refreshing of the data in this widget. If not activated, the widget is updated only when the dashboard is opened or when you click the Refresh button on the widget in the dashboard. |
| Refresh Interval | If you activate the Refresh Content option, specify how often to refresh the data in this widget. |
