


The Environment Overview widget displays the health, risk, and efficiency of resources for a given object from the managed inventory.
How the Environment Overview Widget and Configuration Options Work
You can add the Environment Overview widget to one or more custom dashboards.
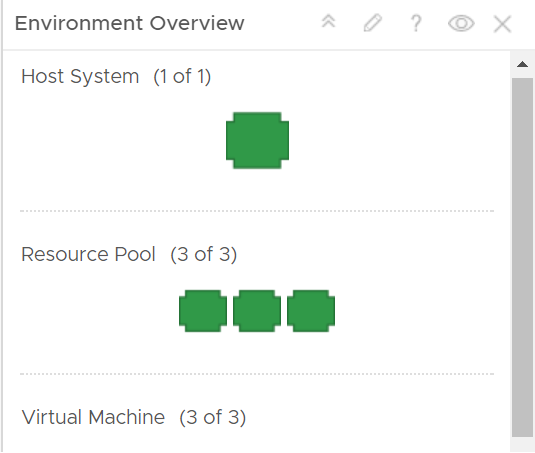
The widget displays data for objects from one or several types. The data that the widget displays depends on the object type and category that you selected when you configured the widget.
The objects in the widget are ordered by object type.
The parameters for the health, risk, and efficiency of an object appear in a tool tip when you point to the object.
When you double-click an object on the Environment Overview widget, you can view detailed information for the object.
To use the Environment Overview widget, you must add it to the dashboard and configure the data that appears in the widget. You must select at least one badge and an object. Additionally, you can select an object type.
The Environment Overview widget has basic and advanced configuration options. The basic configuration options are activated by default.
To use all features of the Environment Overview widget, you must change the default configuration of the widget. Log in to the vRealize Operations machine and set skittlesCustomMetricAllowed to true in the web.properties file. The web.properties file is located in the /usr/lib/vmware-vcops/user/conf/web folder. The change is propagated after you use the service vmware-vcops-web restart command to restart the UI.
You must use the Badge tab to select the badge parameters that the widget shows for each object. You must use the Config tab to select an object or object type. To observe a concrete object from the inventory, you can use the Basic option. To observe a group of objects or objects from different types, you must use the Advanced option.
Where You Find the Environment Overview Widget
The widget might be included on any of your custom dashboards. From the left menu, click to see your configured dashboards.
To customize the data that appears in the dashboard widget, from the left menu, click . To create your dashboard, from the left menu, click . From the Dashboards panel, click Create. To edit your dashboard, from the left menu, click . From the Dashboards panel, select the dashboard you want to edit and select . Toggle between the Views and Widgets option to view and add a widget or view to the dashboard. The widgets list panel displays a list of all the predefined widgets. Drag a widget to the dashboard workspace in the upper panel.
Environment Overview Widget Toolbar Options
On the title bar of the widget, click the Show Toolbar icon to access the toolbar options.
The toolbar contains icons that you can use to get more information about badges.
| Option | Description |
|---|---|
| Badge | You can select a Health, Risk, or Efficiency badge for objects that appear in the widget. The tool tip of a badge shows the standard name of the badge. |
| Status | You can filter objects based on their badge status and their state. |
| Sort | You can sort objects by letter or by number. |
Environment Overview Widget Configuration Options
On the title bar of the widget, click the Edit Widget icon to configure the widget.
| Option | Description |
|---|---|
| Title | Enter a custom title that identifies this widget from other instances that are based on the same widget template. |
| Selected Object | Object that is the basis for the widget data. To populate the text box, select and select an object from the list. |
| Refresh Content | Activate or deactivate the automatic refreshing of the data in this widget. If not activated, the widget is updated only when the dashboard is opened or when you click the Refresh button on the widget in the dashboard. |
| Refresh Interval | If you activate the Refresh Content option, specify how often to refresh the data in this widget. |
| Self Provider |
Indicates whether the objects for which data appears in the widget are defined in the widget or provided by another widget.
|
| Badge | Defines a parameter to observe. You can select or deselect Health, Risk, and Efficiency parameters using check boxes. Default configuration of the widget selects all badges. Select at least one badge parameter. |
| Config | Basic List of objects in your environment that you can search or sort by column so that you can locate the object on which you are basing the data that appears in the widget. |
| Advanced You can use Object Types to select a type of the objects to observe information about health, risk, and efficiency. Double-click the object type to select it. Use the Adapter Type drop-down menu to filter the objects types based on an adapter. You can use the Use vSphere Default button to observe the main vSphere object types. To remove an object type from the list, click Remove Selected next to Use vSphere Default. You can use the Object Type Categories menu to select a group or groups of object types to observe. You can use the Object tree to select an object to filter the displayed objects. For example, to observe a datastore of a VM, double-click Datastore from the Object Types menu to select it. Click the datastore when it is in the list of object types, and find the VM in the object tree and select it. To return to your previous configuration of the widget, click Datastore from the list of object types and click Deselect All in the object tree window. The metrics tree and badge data grids are available configuration options only if the default configuration of the widget is changed. To use these configuration options, log in to the vRealize Operations machine and set skittlesCustomMetricAllowed to true in the web.properties file. The web.properties file is located in the /usr/lib/vmware-vcops/user/conf/web folder. |
