


The DRS Cluster Settings widget displays the workload of the available clusters and the associated hosts. You can change the Distributed Resource Scheduler (DRS) automation rules for each cluster.
How the DRS Cluster Settings Widget and Configuration Options Work
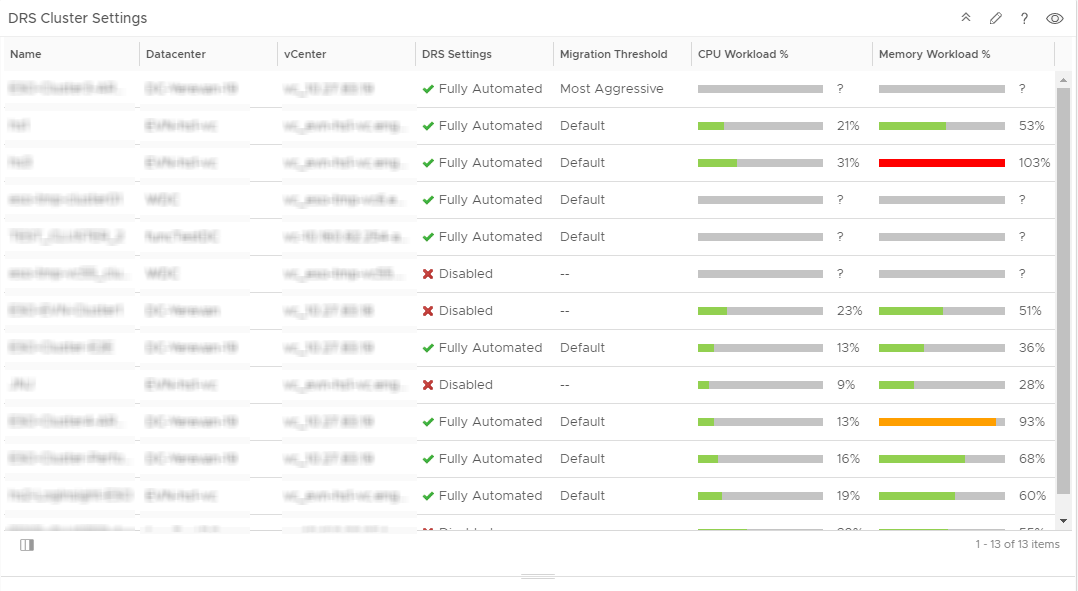
You can view CPU workload and memory workload percentages for each of the clusters. You can view CPU workload and memory workload percentages for each host in the cluster by selecting a cluster in the data grid. The details are displayed in the data grid below. You can set the level of DRS automation and the migration threshold by selecting a cluster and clicking .
You edit a DRS Cluster Settings widget after you add it to a dashboard. To configure the widget, click the edit icon at the upper-right corner of the widget window. You can add the DRS Cluster Settings widget to one or more custom dashboards and configure it to display data that is important to different dashboard users. The data that appears in the widget is based on the configured options for each widget instance.
The DRS Cluster Settings widget appears on the dashboard named vSphere DRS Cluster Settings, which is provided with vRealize Operations.
Where You Find the DRS Cluster Settings Widget
The widget might be included on any of your custom dashboards. From the left menu, click to see your configured dashboards.
To customize the data that appears in the dashboard widget, from the left menu, click . To create your dashboard, from the left menu, click . From the Dashboards panel, click Create. To edit your dashboard, from the left menu, click . From the Dashboards panel, select the dashboard you want to edit and select . Toggle between the Views and Widgets option to view and add a widget or view to the dashboard. The widgets list panel displays a list of all the predefined widgets. Drag a widget to the dashboard workspace in the upper panel.
DRS Cluster Settings Widget Toolbar Options
On the title bar of the widget, click the Show Toolbar icon to access the toolbar options.
| Option | Description |
|---|---|
| Cluster Actions | Limits the list to actions that match the cluster you select. |
| Show | The drop-down menu displays the parent vCenter Server instances where the clusters reside. You can also view the data centers under each parent vCenter Server instance. Select a parent vCenter Server to view the workload of the available clusters in the data grid. The default setting displays the clusters across all vCenters. |
| Filter | Filters the data grid by name, data center, vCenter, DRS settings, and migration threshold. |
DRS Cluster Settings Widget Data Grid Options
The data grid provides information on which you can sort and search.
| Option | Description |
|---|---|
| Name | Displays the names of the clusters in the selected parent vCenter Server instance. |
| Datacenter | Displays the data centers that belong to each cluster. |
| vCenter | Displays the parent vCenter Server instance where the cluster resides. |
| DRS Settings | Displays the level of DRS automation for the cluster. To change the level of DRS automation for the cluster, select from the toolbar. You can change the automation level by selecting an option from the drop-down menu in the Automation Level column. |
| Migration Threshold | Recommendations for the migration level of virtual machines. Migration thresholds are based on DRS priority levels, and are computed based on the workload imbalance metric for the cluster. |
| CPU Workload % | Displays the percentage of CPU in GHz available on the cluster. |
| Memory Workload % | Displays the percentage of memory in GB available on the cluster. |
DRS Cluster Settings Configuration Options
On the title bar of the widget, click the Edit Widget icon to configure the widget.
The configuration options are grouped into one or more sections. You can select the objects on which you want to base the widget data and refine the objects in the following sections. Each section filters the objects further and pushes the filtered objects to the next section. The widget data is based on the objects that are the output of the last section.
The Configuration section provides general configuration options for the widget.
| Option | Description |
|---|---|
| Title | Enter a custom title that identifies this widget from other instances that are based on the same widget template. |
| Configuration | |
| Refresh Content | Activate or deactivate the automatic refreshing of the data in this widget. If not activated, the widget is updated only when the dashboard is opened or when you click the Refresh button on the widget in the dashboard. |
| Refresh Interval | If you activate the Refresh Content option, specify how often to refresh the data in this widget. |
