


The Topology Graph widget gives a graphical presentation of objects and their relationships in the inventory. You can customize each instance of the widget in your dashboard.
How the Topology Graph Widget and Configuration Options Work
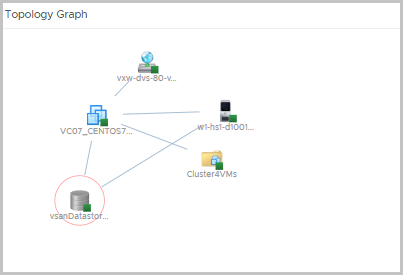
The Topology Graph widget enables you to explore all nodes and paths connected to an object from your inventory. Connection between the objects might be a logical, physical, or network connection. The widget can display a graph that shows all of the nodes in the path between two objects, or that shows the objects related to a node in your inventory. You select the type of graph in the Exploration Mode when you configure the widget. You can select the levels of exploration between nodes in the displayed graph by using Relationship check boxes when you edit the widget. The widget displays all object types in the inventory by default, but you can select object types to view by using the Object View list during the configuration process. Double-clicking an object on the graph takes you to a detailed page about the object.
Where You Find the Topology Graph Widget
The widget might be included on any of your custom dashboards. From the left menu, click to see your configured dashboards.
To customize the data that appears in the dashboard widget, from the left menu, click . To create your dashboard, from the left menu, click . From the Dashboards panel, click Create. To edit your dashboard, from the left menu, click . From the Dashboards panel, select the dashboard you want to edit and select . Toggle between the Views and Widgets option to view and add a widget or view to the dashboard. The widgets list panel displays a list of all the predefined widgets. Drag a widget to the dashboard workspace in the upper panel.
Topology Graph Widget Toolbar Options
On the title bar of the widget, click the Show Toolbar icon to access the toolbar options.
| Option | Description |
|---|---|
| Action | Use to select from predefined actions for each object type. To see available predefined actions, select an object in the graph and click the toolbar to select an action. For example, when you select a datastore object in the graph, you can click Delete Unused Snapshots for Datastore to apply this action to the object. |
| Dashboard Navigation | Takes you to a predefined object. For example, when you select a datastore from the graph and click Dashboard Navigation, you can open the datastore in the vSphere Web Client. |
| Pan | Use to move the entire graph. |
| Show values on point | Provides a tool tip with parameters when you point to an object in the graph. |
| Zoom in | Zooms in the graph. |
| Zoom out | Zooms out the graph. |
| Hierarchical View | Use to switch to hierarchical view. Hierarchical view is enabled only for Node Exploration mode and with selected inventory tree. |
| Graph View | Use to switch to graph view. |
| Object Detail | Select an object and click this icon to show the Object Detail page for the object. |
| Expand Node | Selects which object types related to your object to show on the graph. For example, if you select a virtual machine from the graph and click Expand Node toolbar icon and select Host System, the host on which the virtual machine is located is added to the graph. |
| Hide Node(s) | Use to remove a given object from the graph |
| Reset To Initial Object | Use to return to the initially displayed graph and configured object types. |
| Explore Node | Use to explore a node from a selected object in the graph. For example, if the graph displays a connection between a VM, a host, and a datastore, and you want to check the connection of the host with the other objects in the inventory, you can select the host and click Explore Node. |
| Status | Use to select objects based on their status or their state. |
Topology Graph Widget Configuration Options
On the title bar of the widget, click the Edit Widget icon to configure the widget.
The configuration options are grouped into one or more sections. You can select the objects on which you want to base the widget data and refine the objects in the following sections. Each section filters the objects further and pushes the filtered objects to the next section. The widget data is based on the objects that are the output of the last section.
The Configuration section provides general configuration options for the widget.
The Input Data section provides options to specify input for the widget. This section appears when the widget is in self provider mode.
| Option | Description |
|---|---|
| Title | Enter a custom title that identifies this widget from other instances that are based on the same widget template. |
| Configuration | |
| Refresh Content | Enable or disable the automatic refreshing of the data in this widget. If not enabled, the widget is updated only when the dashboard is opened or when you click the Refresh button on the widget in the dashboard. |
| Refresh Interval | If you enable the Refresh Content option, specify how often to refresh the data in this widget. |
| Self Provider |
Indicates whether the objects for which data appears in the widget are defined in the widget or provided by another widget.
|
| Exploration Mode | Use Node Exploration mode to observe a selected object from an object list and the objects related to it. For example, if you select a virtual machine and select node exploration mode, the widget shows the host where the VM is placed and the datastore storing the files of the VM. Use Path Exploration mode to observe the relation between two objects. You must select them from the Select First Object list and the Select Second Object list. For example, if you select to explore the path between a VM and a vCenter Server, the graph shows you both objects and all nodes in the path between the VM and server as datastore, datastore cluster, and data center.
Important: To select object view is mandatory for the widget to start working in path exploration mode.
|
| Show Paths | Use All to observe connections between a node and nodes related to it as well as connections between the nodes. For example, if you are using node exploration mode and you select to observe a VM and all objects types, the graph shows a VM connected to its datastore and host and the connection between the host and datastore. |
| Use Discovered Only to observe directly related nodes. For example, if you are using node exploration mode and you select to observe a VM and all objects types, the graph will shows the VM connected to its datastore and to its host, but without the connection between the host and datastore. | |
| Configuration File | The default configuration includes parent and child relationship. Drop-down options depend on the installed Solutions. You can add a new type of relationship to the Relationship pane. |
| Metric Configuration | Specifies a list with attributes to display. |
| Layout | Select whether you want a graph view or hierarchical view for the topology graph. |
| Tree type | For a hierarchical layout, select whether you want a tree type view. |
| Input Data | |
| Selected object | From the object list, select an object on which you want to base the widget data. |
| Degree of separation | Available only when node exploration mode is selected. Use to define the levels of exploration in node exploration mode. The lowest degree configuration shows only directly related nodes rather than higher degrees that show the inventory in details. |
| Select First Object | Available only in path exploration mode. Select the first object from the object list. |
| Select Second Object | Available only in path exploration mode. Select the second object from the object list. |
| Object view | Use to select which types of objects to observe in the graph. |
| Relationship | Select the type of relationship between objects to observe in the graph, respectively the details about your inventory . The common relationships for all objects are parent and child, but the list of relationships can vary depending on added solutions to vRealize Operations. |
