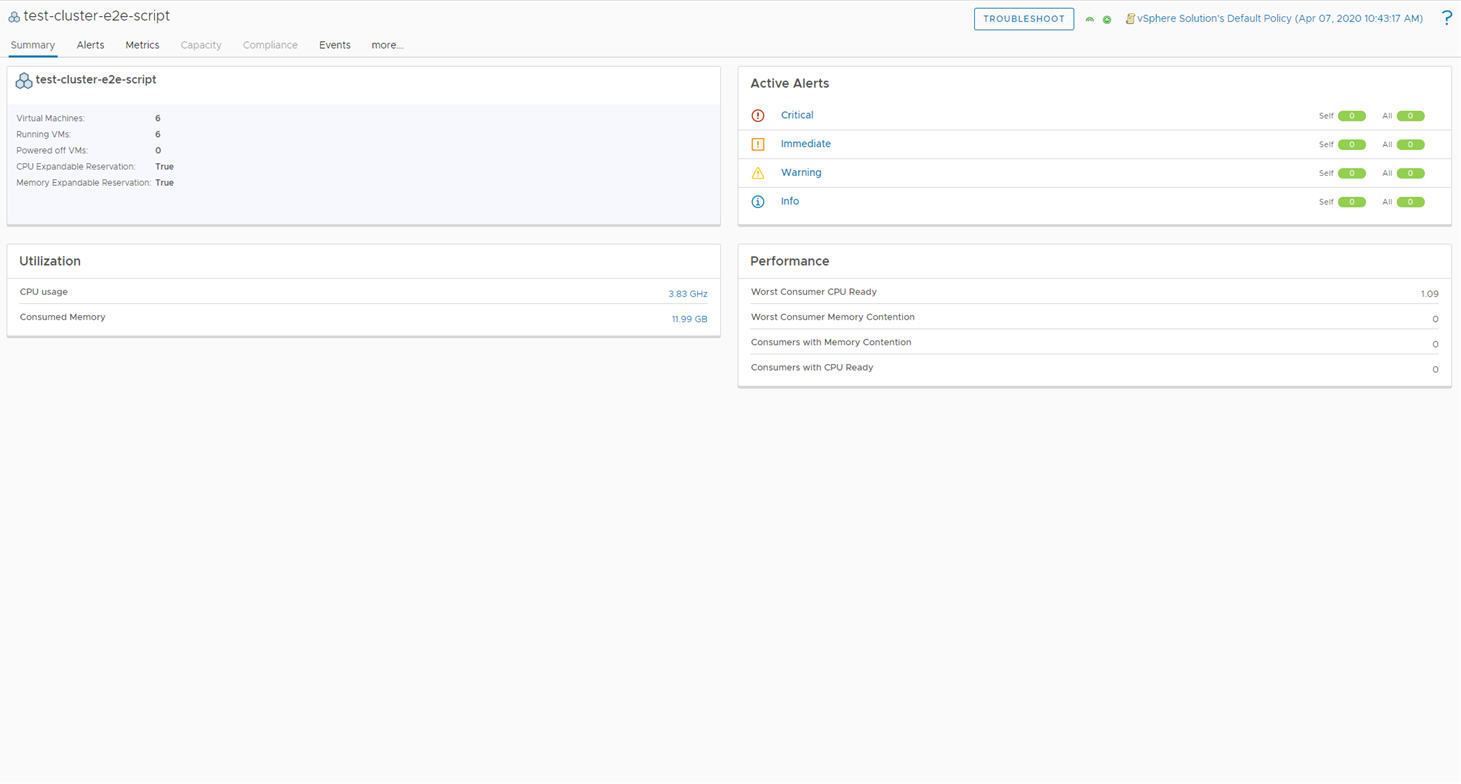
The Tanzu Kubernetes cluster runs Kubernetes workloads natively on the hypervisor layer. The Tanzu Kubernetes cluster Summary tab provides an overview of the state of the Tanzu Kubernetes clusters.
Understanding the Tanzu Kubernetes cluster Summary Tab

| Option | Description |
|---|---|
| Troubleshoot | Start the Troubleshooting Workbench with the current object in context. |
| Object Summary | This widget displays the details of the selected object. The widget also displays the number of resources associated with the selected object. |
| Active Alerts |
This widget provides a visual indicator of the alert status for the following alert types.
To see the alerts for the object, click the badge . |
| Utilization | This widget is used to find out the trends in capacity used by a selected Tanzu Kubernetes cluster as against the total capacity available.
The key utilization indicators are:
|
| Performance | This widget displays the summary metrics about the overall performance of the object. It displays the latest value and a trend line of the various key performance indicators in a color that indicates its health based on the symptom associated with the metrics. Click each metric to see the expanded chart.
Key performance indicators are:
|