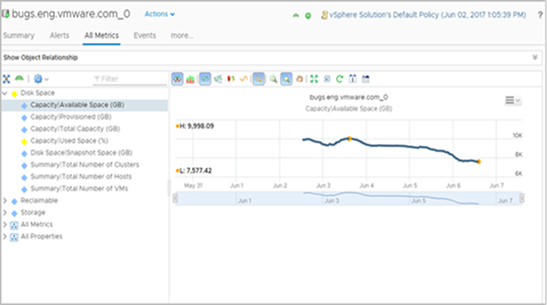
The All Metrics tab provides a relationship map and user-defined metric charts. The topological map helps you evaluate objects in the context of their place in your environment topology. The metric charts are based on the metrics for the selected object that you think helps identify the possible cause of a problem in your environment.

You can also build your own set of metric charts. You select the objects and metrics that provide you with a detailed view of changes to different metrics for a single object, or for related objects over time.
Where available, the All Metrics tab provides pre-defined sets of metrics to help you when looking at a specific aspect of an object. For example, if you have a problem with a host, access the most relevant information about the host by looking at the metrics displayed in the pre-defined lists. You can edit these groups of metrics, and create additional groups, by dragging and dropping metrics and properties from the All Metrics and All Properties lists.
For more information about the metrics, refer to the Definitions for Metrics, Properties, and Alerts Guide.
Where You Find the All Metrics Tab
- From the left menu, click Environment, then select a group, custom data center, application, or inventory object.
- Alternatively, click Environment, then use the hierarchies in the left pane to quickly drill down to the objects that you want.