


The Mashup Chart widget shows disparate pieces of information for a resource. It shows a health chart and metric graphs for key performance indicators (KPIs).
How the Mashup Chart Widget and Configuration Options Work
The Mashup Chart widget contains charts that show different aspects of the behavior of a selected resource. By default, the charts show data for the past six hours.
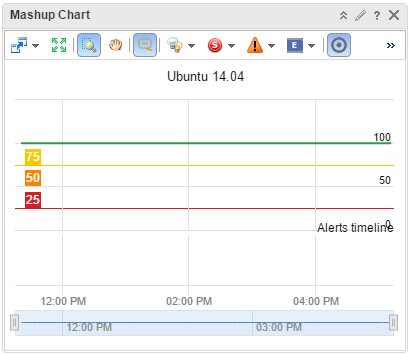
- A Health chart for the object, which can include each alert for the specified time period. Click an alert to see more information, or double-click an alert to open the Alert Summary page.
- Metric graphs for any or all the KPIs for any objects listed as a root cause object. For an application, this chart shows the application and any tiers that contain root causes. You can select the KPI to include by selecting on the widget toolbar. Any shared area on a graph indicates that the KPI violated its threshold during that time period.
The metric graphs reflect up to five levels of resources, including the selected object and four child levels.
You edit a Mashup Chart widget after you add it to a dashboard. The changes you make to the options create a custom widget to meet the needs of the dashboard users.
Where You Find the Mashup Chart Widget
The widget might be included on any of your custom dashboards. From the left menu, click to see your configured dashboards.
To customize the data that appears in the dashboard widget, from the left menu, click . To create your dashboard, from the left menu, click . From the Dashboards panel, click Create. To edit your dashboard, from the left menu, click . From the Dashboards panel, select the dashboard you want to edit and select . Toggle between the Views and Widgets option to view and add a widget or view to the dashboard. The widgets list panel displays a list of all the predefined widgets. Drag a widget to the dashboard workspace in the upper panel.
Mashup Chart Widget Toolbar Options
On the title bar of the widget, click the Show Toolbar icon to access the toolbar options.
The toolbar contains icons that you can use to change the view.
| Option | Description |
|---|---|
| Filters | Filter data based on criticality, status, and alert type. |
| Event Filters | Filter based on the type of event such as, change, notification, and fault. |
| Date Controls | Use the date selector to limit the data that appears in each chart to the time period you are examining. Select Dashboard Time to enable the dashboard time panel. The option chosen in the dashboard time panel is effective. The default time is 6 hours. Dashboard Time is the default option. |
| Dashboard Navigation | You can navigate to another dashboard when the object under consideration is also available in the dashboard to which you navigate. |
Mashup Chart Widget Configuration Options
On the title bar of the widget, click the Edit Widget icon to configure the widget.
The configuration options are grouped into one or more sections. You can select the objects on which you want to base the widget data and refine the objects in the following sections. Each section filters the objects further and pushes the filtered objects to the next section. The widget data is based on the objects that are the output of the last section.
The Configuration section provides general configuration options for the widget.
The Input Data section provides options to specify input for the widget. This section appears when the widget is in self provider mode.
| Option | Description |
|---|---|
| Title | Enter a custom title that identifies this widget from other instances that are based on the same widget template. |
| Configuration | |
| Refresh Content | Enable or disable the automatic refreshing of the data in this widget. |
| Refresh Interval | If you enable the Refresh Content option, specify how often to refresh the data in this widget. |
| Self Provider |
Indicates whether the objects for which data appears in the widget are defined in the widget or provided by another widget.
|
| Input Data | |
| Object | Search for objects in your environment and select the object on which you are basing the widget data. You can also click the Add Object icon and select an object from the object list. You can use the Filter text box to refine the object list and the Tag Filter pane to select an object based on tag values. |
