After you activate the Security Intelligence feature, by default, it begins collecting network traffic data on all standalone hosts and cluster of hosts. If necessary, you can optionally stop data collection from a standalone host or cluster of hosts. You can also configure to pause or reduce the data retention on all standalone hosts and cluster of hosts.
The following image illustrates the Data Collection tab in the page. 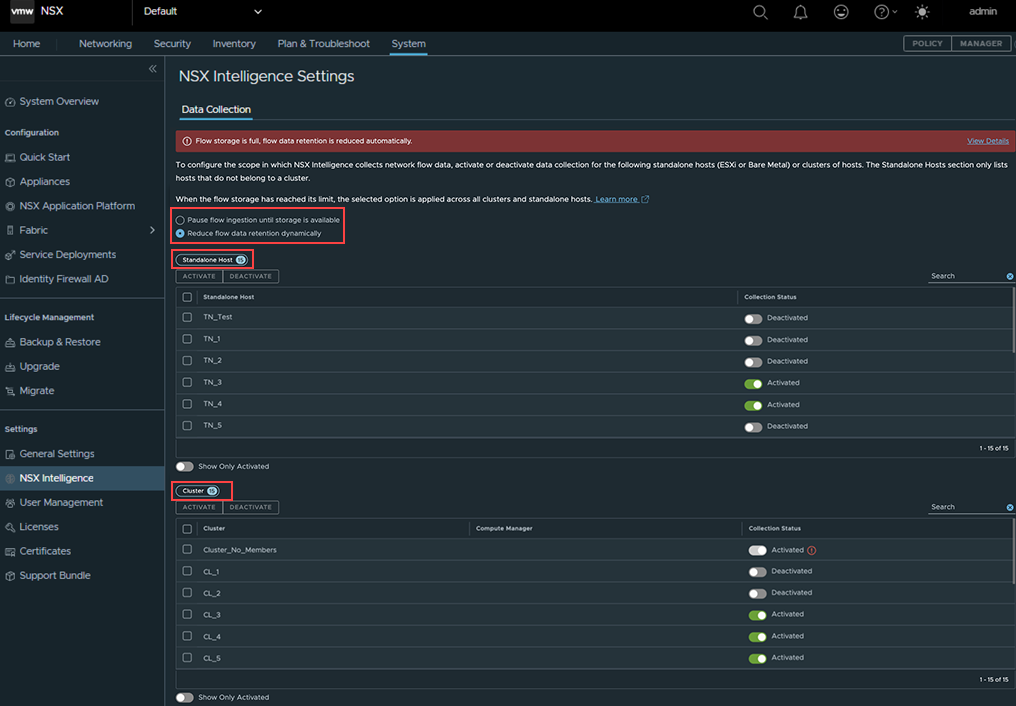
The Standalone Host section only lists the hosts that do not belong to a cluster and hosts that are not managed by a compute manager. The Cluster section, lists all the clusters in your NSX environment.
You cannot deactivate or activate data collection for a single host that belongs to a cluster. You can only deactivate or activate data collection on the entire cluster to which that host belongs. When data collection is deactivated for a cluster, Security Intelligence or NSX Network Detection and Response stops collecting data on all the hosts that belong to that cluster. Similarly, if data collection mode is activated on a cluster, Security Intelligence or NSX Network Detection and Response starts collecting data on all the hosts that belong to that cluster.
If the data collection mode is deactivated for a standalone host and that host is added to a cluster whose data collection is activated, the Security Intelligence or NSX Network Detection and Response starts collecting data on that host after it joins that cluster. Conversely, if a standalone host has its data collection mode activated and it is added to a cluster whose data collection is deactivated, Security Intelligence or NSX Network Detection and Response stops data collection on that host after it joins that cluster.
Procédure
- From your browser, log in with Enterprise Administrator privileges to an NSX Manager appliance at https://<nsx-manager-ip-address>.
- In the NSX Manager user interface, select .
- To configure data ingestion or data retention on all standalone hosts and cluster of hosts, perform one of the following steps.
-
-
Pause flow ingestion until storage is available
-
Temporarily suspends the flow of data ingestion when analytics and data storage disk is nearing the maximum capacity. When the disk usage exceeds a threshold, the flow of data ingestion is paused across all clusters and standalone hosts.
The formula is, threshold = flow storage - 3 * daily average usage. The threshold is determined by the daily average usage, which is calculated by the current disk usage divided by the number of days of data in storage.
The predicted usage is based on the existing usage. When the predicted usage drops below the threshold, the flow of data ingestion is resumed. The formula is, predicted usage = data retention period * daily average usage.
There are two ways to resume the flow of data ingestion.
- Scale-out to increase the data storage disk volume and the threshold.
- Select the Reduce flow data retention dynamically option to reduce the data retention period and the data size.
See the Scale Out the NSX Application Platform topic in the Deploying and Managing the VMware NSX Application Platform guide.
-
-
Reduce flow data retention dynamically
-
Reducing flow data retention decreases the number of days the data is stored in the database. This option prunes old data and saves storage space. The data retention is calculated based on two key factors: the size of the data and the average amount of data received per day.
To illustrate, here are some data retention scenarios:
- Scenario 1: If initial data retention is configured for 30 days, and by day 15, the disk is full. The data retention is set to 15 days.
- Scenario 2: If initial data retention is configured for 30 and very little data is received for the first 14 days. Then, on day 15, there is a data influx, causing the disk to become full. The data retention is reduced to 15 days.
- Scenario 3: If initial data retention is configured for 30 days, the disk is full on day two. The data retention is reduced to two days.
You can view the data retention period and number of existing flows.
- Select and scroll to the Druid Average Retention Days.
- Select and scroll to the Total Flows and Unique Flows.
- To manage traffic data collection for one or more hosts, perform one of the following steps.
- To stop traffic data collection, select the host or hosts in the Standalone Host section, click Deactivate, and click Confirm when prompted if you are sure.
- To start traffic data collection, select the host or hosts, click Activate, and click Confirm when prompted if you are sure.
The system updates the Collection Status value for each affected host to Deactivated or Activated, depending on the data collection mode you had set.
- To manage traffic data collection for one or more clusters of hosts, perform one of the following steps.
- To stop data collection for one or more clusters, select the cluster or clusters in the Cluster section, click Deactivate, and click Confirm when prompted if you are sure.
- To start traffic data collection, select the cluster or clusters, click Activate, and click Confirm when prompted if you are sure.
Résultats
The system updates the Collection Status value for each affected cluster to Deactivated or Activated, depending on the data collection mode you had set.


