


This topic describes how developers can monitor and troubleshoot their apps using Pivotal Cloud Foundry (PCF) Metrics.
Overview
PCF Metrics helps you understand and troubleshoot the health and performance of your apps by offering the following:
- Container Metrics: Three graphs measuring CPU, memory, and disk usage percentages
- Network Metrics: Three graphs measuring requests, HTTP errors, and response times
- Custom Metrics: User-customizable graphs for measuring app performance, such as Spring Boot Actuator gauge metrics
- App Events: A graph of update, start, stop, crash, SSH, and staging failure events
- Logs: A list of app logs that you can search, filter, and download
- Monitors (Beta): User-defined monitors with configurable trigger thresholds based on app metrics and events
- Trace Explorer: A dependency graph that traces a request as it flows through your apps and their endpoints, along with the corresponding logs
The following sections describe a standard workflow for using PCF Metrics to monitor or troubleshoot your apps.
View an App
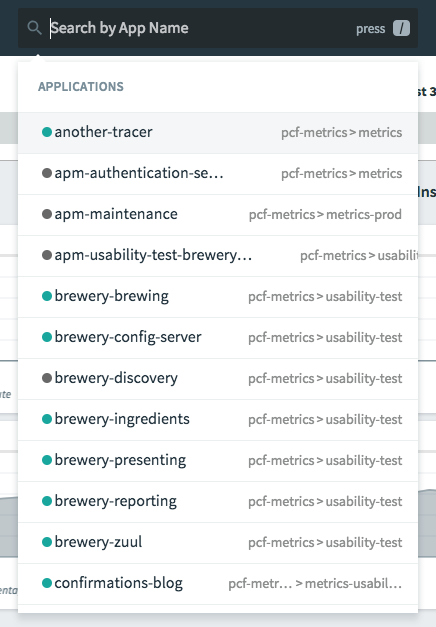
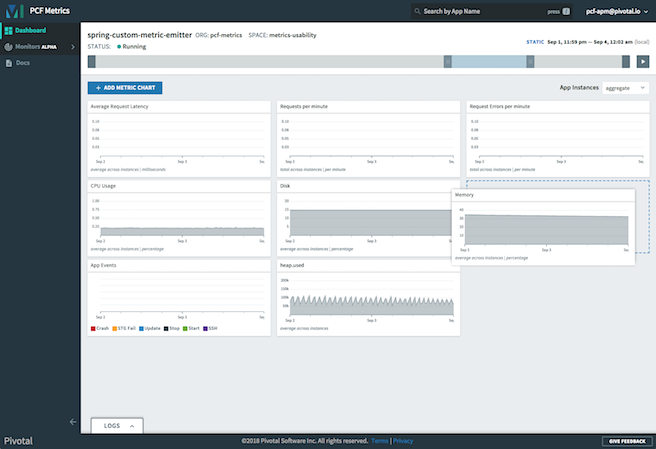
In a browser, navigate to metrics.YOUR-SYSTEM-DOMAIN and log in with your User Account and Authentication (UAA) credentials. Choose an app for which you want to view metrics or logs. PCF Metrics respects UAA permissions such that you can view any app that runs in a space that you have access to.
PCF Metrics displays app data for a given time frame. See the sections below to Change the Time Frame for the dashboard, Interpret Metrics information on each graph, and Trace App Requests with the Trace Explorer.

Change the Time Frame
The graphs show time along the horizontal axis. You can change the time frame for all graphs and the logs by using the time selector at the top of the window. Adjust either end of the selector or click and drag.

Zoom: From within any graph, click and drag to zoom in on areas of interest. This adjusts all of the graphs, and the logs, to show data from that time frame.
Streaming Metrics
Streaming Metrics mode allows the metrics charts on your dashboard to be updated in real-time as metrics data is ingested.
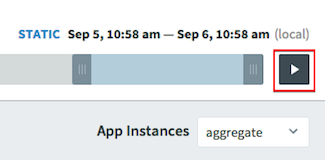
To enable streaming metrics visualization, click the PLAY button next to the timeline in the top right of the dashbboard. This will show three hours of streamed metrics data. You can drag the left end of the selector to increase or decrease the duration of streaming metrics being displayed.
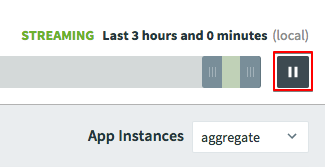
Note: The Logs drawer is not available while metrics data is being streamed. To view Logs, pause streaming by clicking the PAUSE button next to the timeline in the top right of the dashbboard, or simply click the Logs tab at the bottom of the dashboard to pause Metrics streaming and open the Logs drawer.
The time frame can be modified in both Streaming and Static Metrics modes.
Add, Edit, and Delete Charts
The PCF Metrics dashboard allows users to add, edit, and delete charts.
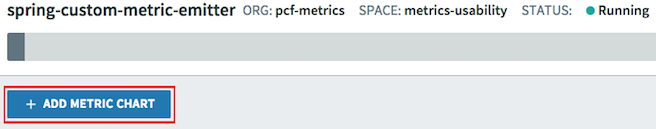
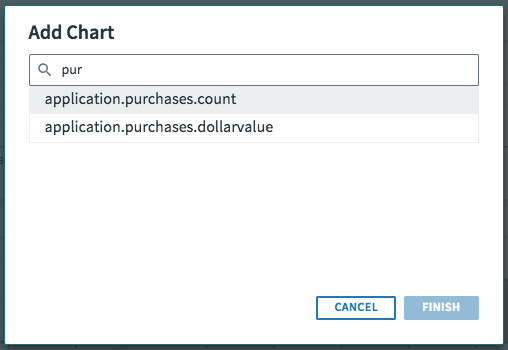
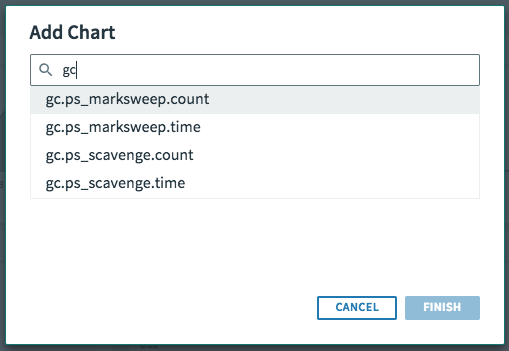
Add Chart: To add a new chart, follow the steps below.
- Click + ADD METRIC CHART at the top left of the dashboard.
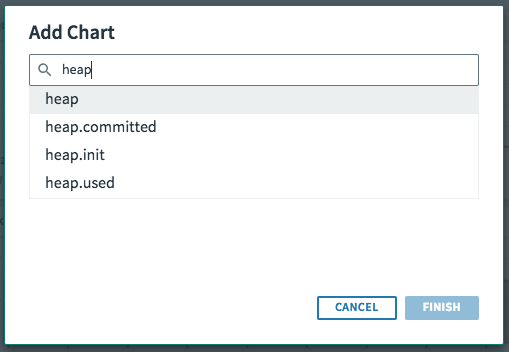
- In the modal window, either select a metric from the dropdown menu or type the name of the metric into the search bar to filter results.
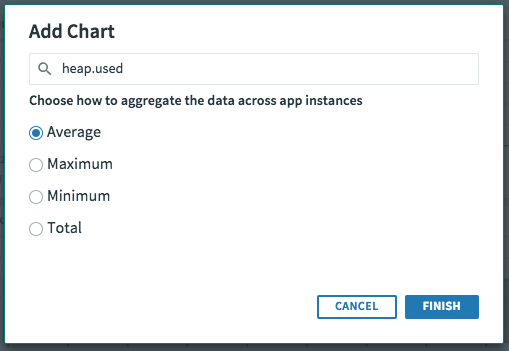
- Select an aggregation type. This determines how to combine the data from multiple instances.
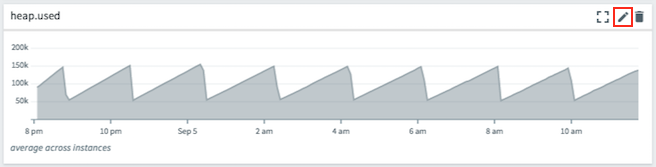
Edit Chart: To change how instances are aggregated for an existing metric, click the pencil icon on the header of the metric chart. When the Edit Chart modal window appears, you can choose the aggregation type and click Save to apply changes.
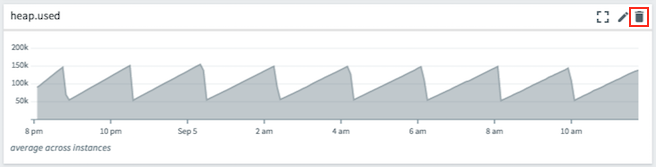
Delete Chart: To delete an existing chart on the dashboard, click the trash can icon on the header of the metric chart and then click Delete.
View and Reorder Metric Charts
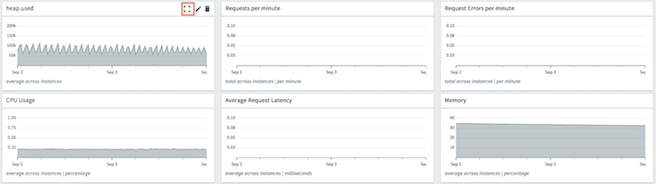
Reorder: Each metric has its own chart. You can click and drag the chart header to change the ordering of charts.
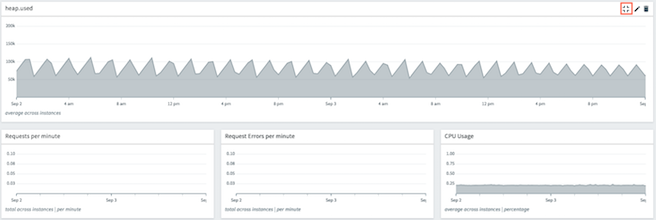
Expand: To see more details in complex graphs, you can expand a chart by clicking the icon in the chart header.
You can collapse the chart by clicking the icon again.
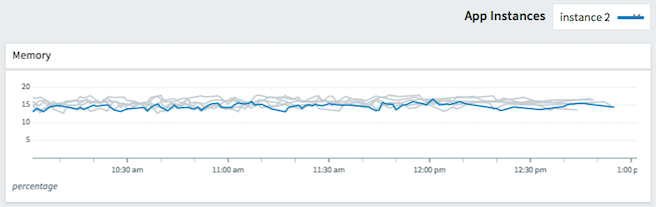
View Metrics at App-Instance Level
PCF Metrics relays metric data at the app-instance level to allow for an in-depth troubleshooting experience. Users are able to view the app metrics related to a specific instance index, which correlates directly with the app instance indices shown in Apps Manager.
To view a specific app instance, select the desired instance from the instance filter dropdown menu at the top right of the dashboard.
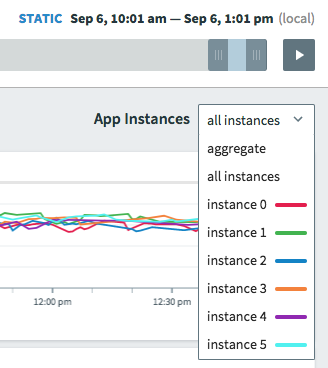
Alternatively, you can click on an instance line on the metric chart that interests you while All Instances is selected in the dropdown.
Interpret Metrics
See the following sections to understand how to use each of the views on the dashboard to monitor and troubleshoot your app.
Container Metrics
Three Container Metrics charts are available on the PCF Metrics dashboard:
-
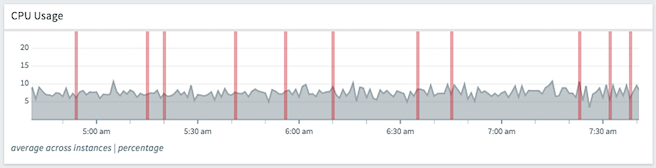
CPU usage percentage:
A spike in CPU might point to a process that is computationally heavy. Scaling app instances can relieve the immediate pressure, but you need to investigate the app to better understand and fix the root cause. -
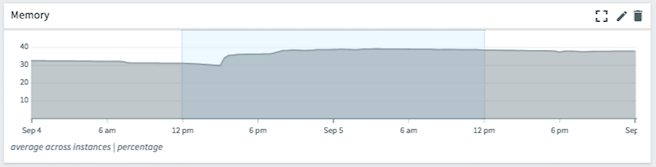
Memory usage percentage:
A consistent, gradual increase in memory might mean a resource leak in the code. Scaling app memory can relieve the immediate pressure, but you need to find and resolve the underlying issue so that it does not occur again. -
Disk usage percentage:
A spike in disk might mean the app is writing logs to files instead of STDOUT, caching data to local disk, or serializing large sessions to disk.
Network Metrics
Three Network Metrics charts are available on the PCF Metrics dashboard:
-
Number of network requests per minute:
A spike in HTTP requests means more users are using your app. Scaling app instances can reduce the response time. -
Number of network request errors per minute:
A spike in HTTP errors means one or more 5xx errors have occurred. Check your app logs for more information. -
Average latency of a request in milliseconds:
A spike in response time means your users are waiting longer. Scaling app instances can spread that workload over more resources and result in faster response times.
Events
The Events graph shows the following app events: Crash, Fail (staging failures), Update, Stop, Start, and SSH.
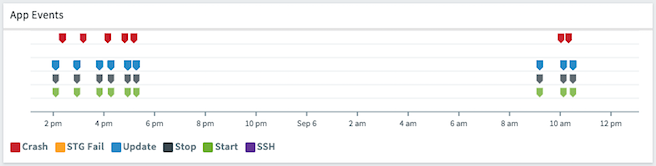
Note: The SSH event corresponds to someone successfully using SSH to access a container that runs an instance of the app.
See the following topics for more information about app events:
Custom Metrics
Users can configure their apps to emit custom metrics out of the Loggregator Firehose and then view these metrics on the PCF Metrics dashboard.
For more information about how to configure apps to emit custom metrics on PCF v2.2 through v2.4, see Metrics Forwarder for PCF.
For more information about how to configure apps to emit custom metrics on PCF v2.5 and later, see Configuring the Metric Registrar.
If you have configured the apps correctly, you should be able to automatically see custom gauge metrics on the PCF Metrics dashboard when you add a chart.
Custom counter metrics are not supported.
In addition, Spring Boot apps with actuators implemented emit Spring Boot Actuator metrics out of the box, without any changes to source code. In PCF Metrics, these metrics look similar to the following:
Access Metrics Data Through MySQL
You can access metrics data through the PCF Metrics datastore.
The table below provides login information.
| Element | Details |
|---|---|
| URL | MySQL VM IP |
| Port | 3306 |
| Username | MYSQL_USER defined in the environment of the metrics-queue app |
| Password | MYSQL_PASSWORD defined in the environment of the metrics-queue app |
| Database | metrics |
| Tables | app_event and app_metric |
To access the MySQL datastore, you can do the following:
Method 1. Use BOSH to SSH into the MySQL VM and run the /var/vcap/packages/pxc/bin/mysql -u<Username> -P<Port> -h<URL> -p command.
Method 2. Assign an external IP to the MySQL VM and a firewall rule to open ports 3306 and 3308 and access MySQL externally.
Method 3. Open a tunnel into your IaaS network and connect that way externally.
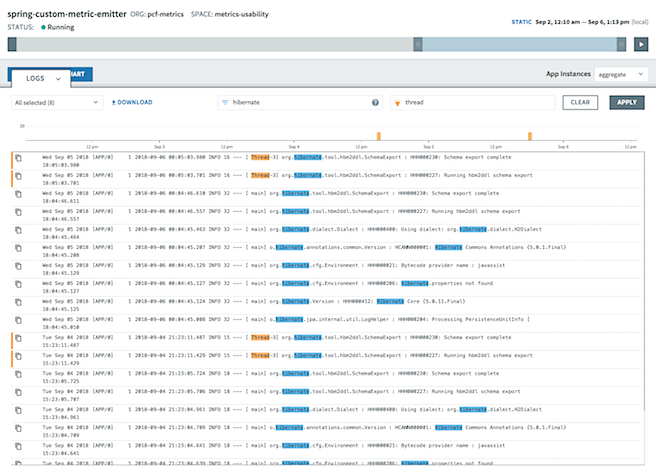
Logs
The Logs view displays app log data ingested from the Loggregator Firehose:
Note: Logs with non-UTF-8 characters or non-standard UUID application GUIDs are not stored.
You can interact with the Logs view in the following ways:
- Keyword: Perform a keyword search. While searching for a keyword, a histogram that shows matching log frequency for the current time frame will be displayed at the top of the Logs drawer. The histogram updates with blue bars based on what you enter. Hover over a histogram bar to view the number of logs for a specific time.
- Highlight: Enter a term to visually highlight within your search. While searching for a keyword and highlighting terms, the histogram updates with yellow bars to indicate where the highlighted terms appear within the Keyword search results. Hover over a histogram bar to view the number of logs for a specific time that contain the highlighted term.
- Sources: Choose which sources to display logs from. For more information, see Log Types and Their Messages.
- Download: Download a file containing logs for the current search.
- Copy: Click the copy icon to copy the text of the log.
- View in Trace Explorer: Open a window to see the trace of the request associated with the log. See Trace App Requests.
Access Logs Data Through PostgreSQL
You can access logs data through the PCF Metrics datastore.
The table below provides login information.
| Element | Details |
|---|---|
| URL | PostgreSQL VM IP |
| Port | 5524 |
| Username | POSTGRES_USERNAME defined in the environment of the logs-queue app |
| Password | POSTGRES_PASSWORD defined in the environment of the logs-queue app |
| Database | metrics |
| Tables | app_log |
To access the PostgreSQL datastore, you can do the following:
Method 1. Use BOSH to SSH into the PostgreSQL VM and run the /var/vcap/packages/postgres-9.6.8/bin/psql -U<Username> -p<Port> <Database> command.
Method 2. Open a tunnel into your IaaS network and connect that way externally.
Monitors (Beta)
PCF Metrics 1.6 includes the Monitors Beta which allows users to create monitors on container, network, and custom metrics, as well as events. Users can also set trigger thresholds on these monitors to be notified via the PCF Metrics UI and webhooks when their criteria is met.
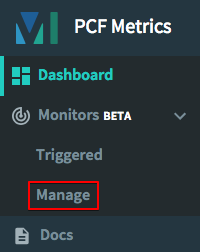
Creating Monitors
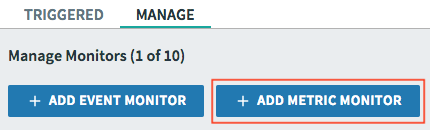
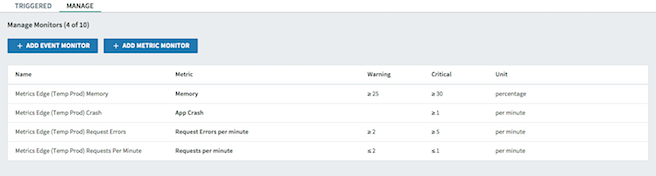
To create and manage monitors, click on the Monitors Beta link in the left menu, then click on Manage.
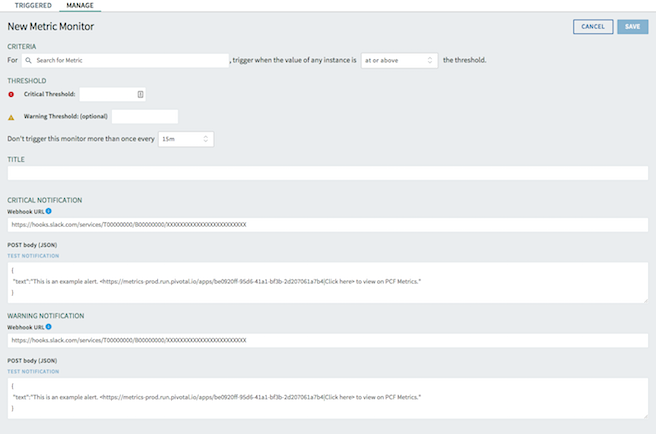
To create a Metrics Monitor, click the + ADD METRIC MONITOR button.
- Select the metric that you want to monitor from the available metrics in the dropdown in the Criteria builder.
- Depending on the type of monitor that you are creating, you can select to trigger the monitor when the returned value is Above or Below the specified threshold.
- Specify a Critical Threshold value (required) on which the monitor will be triggered.
- Specify a Warning Threshold value (optional) if you wish to receive a notification before the monitor reaches the Critical Threshold.
- Select a Trigger freqency to set how often the monitor will send the triggered notifications to the UI or specified webhook.
- Create a Title for the Monitor (will be displayed in the Manage and Triggered Monitors views).
- Enter a webhook URL for Critical Notifications (optional). An example and instructions on how to create Slack webhooks can be found in the UI, but you can specify other webhooks URLs of your choice.
- Enter a webhook URL for Warning Notifications (optional). An example and instructions on how to create Slack webhooks can be found in the UI, but you can specify other webhooks URLs of your choice.
- Modify the JSON body for the notifications as needed. A link to the app’s Mertric’s dashboard is included by default.
- You can send a test of these triggered monitor notifications by clicking the TEST NOTIFICATION link above the JSON body of the Critical and Warning notifications.
- Click the SAVE button to save your monitor.
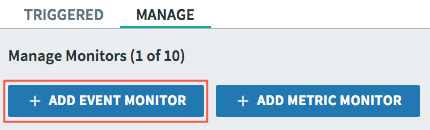
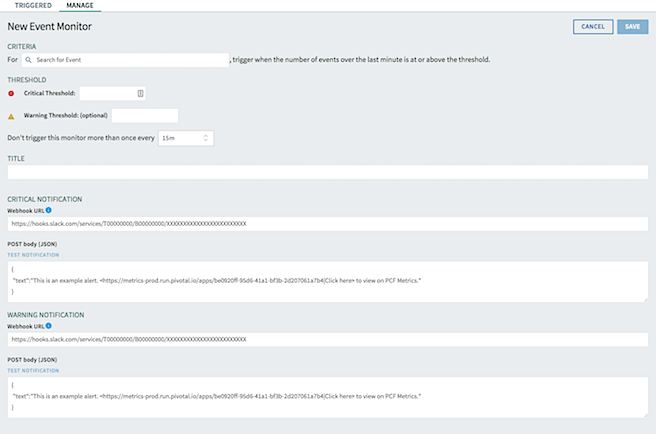
To create an Events Monitor, click the + ADD EVENT MONITOR button.
- Select the event type that you want to monitor from the dropdown in the Criteria builder.
- Specify a Critical Threshold value (required) on which the monitor will be triggered.
- Specify a Warning Threshold value (optional) if you wish to receive a notification before the monitor reaches the Critical Threshold.
- Select a Trigger freqency to set how often the monitor will send the triggered notifications to the UI or specified webhook.
- Create a Title for the Monitor (will be displayed in the Manage and Triggered Monitors views).
- Enter a webhook URL for Critical Notifications (optional). An example and instructions on how to create Slack webhooks can be found in the UI, but you can specify other webhooks URLs of your choice.
- Enter a webhook URL for Warning Notifications (optional). An example and instructions on how to create Slack webhooks can be found in the UI, but you can specify other webhooks URLs of your choice.
- Modify the JSON body for the notifications as needed. A link to the app’s Mertric’s dashboard is included by default.
- You can send a test of these triggered monitor notifications by clicking the TEST NOTIFICATION link above the JSON body of the Critical and Warning notifications.
- Click the SAVE button to save your monitor.
Manage Monitors
Users can find their current monitors under the Manage section of Monitors. To edit or delete a monitor, click the appropriate Monitor from the list and make the necessary changes.
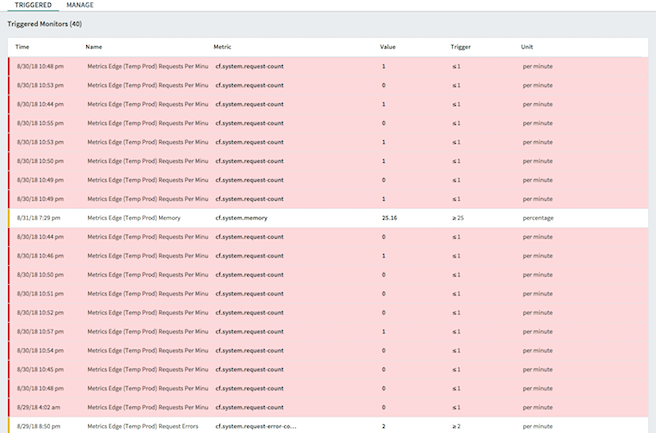
View Triggered Monitors
Users can view previously triggered monitors under the Triggered section of Monitors.
Monitors Endpoint
PCF Metrics 1.6 makes managing application metric and events monitors easier by providing API and YAML file configuration support. For more information, please see our API documentation.
Trace App Requests
A request to one of your apps initiates a workflow within the app or system of apps. The record of this workflow is a trace, which you can use to troubleshoot app failures and latency issues. In the Trace Explorer view, PCF Metrics displays an interactive graph of a trace and its corresponding logs. See the sections below to understand how to use the Trace Explorer.
Prerequisites
PCF Metrics constructs the Trace Explorer view using trace IDs shared across app logs. Before you use the Trace Explorer, examine the following list to ensure PCF metrics can extract the necessary data from your app logs for your specific app type.
- Spring: Follow the steps below.
- Ensure you are using Spring Boot v1.4.3 or later.
- Ensure you are using Spring Cloud Sleuth v1.0.12 or later.
- Add the following to your app dependency file:
dependencies { (2) compile “org.springframework.cloud:spring-cloud-starter-sleuth” } - Node.js, Go, and Python: Ensure that the servers associated with your app do not modify HTTP requests in a way that removes the
X-B3-TraceId,X-B3-SpanId, andX-B3-ParentSpanheaders from a request. You also need to add Trace ID, Span ID, and Parent Span ID to the SLF4J MDC in your app logs to correlate logs within the Trace Explorer. - Ruby: Ruby servers that use a library depending on Rack modify HTTP request headers in a way that is incompatible with PCF Metrics. If you want to trace app requests for your Ruby apps, ensure that your framework does not rely on Rack. You may need to write a raw Ruby server that preserves the
X-B3-TraceId,X-B3-SpanId, andX-B3-ParentSpanheaders in the request. You also need to add Trace ID, Span ID, and Parent Span ID to the SLF4J MDC in your app logs to correlate logs within the Trace Explorer.
Use the Trace Explorer
This section explains how to view the trace for a request received by your app and interact with the Trace Explorer.
- Select an app on the PCF Metrics dashboard.
-
Click the Trace Explorer icon in a log for which you want to trace the request.
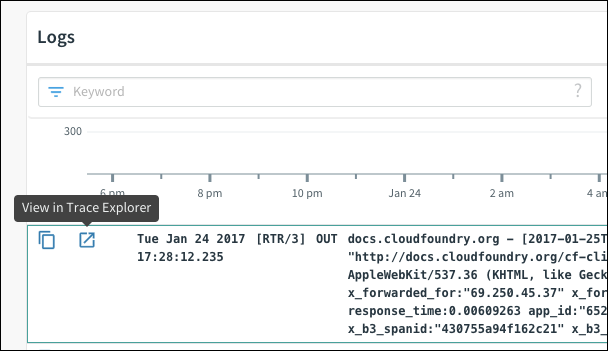
-
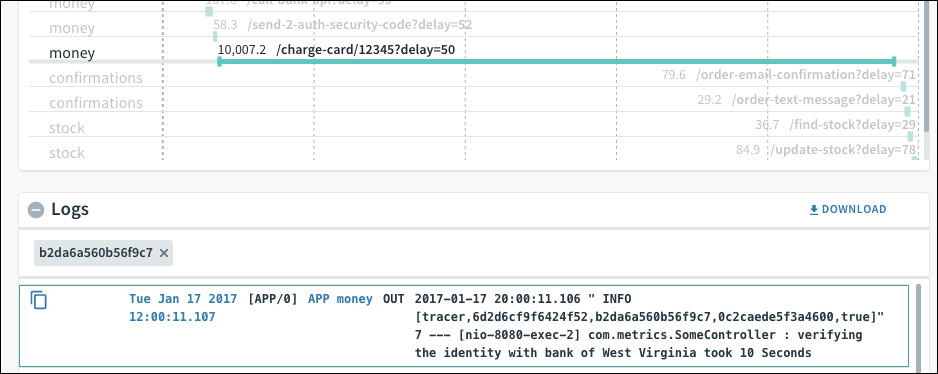
The Trace Explorer displays the apps and endpoints involved in completing a request, along with the corresponding logs:
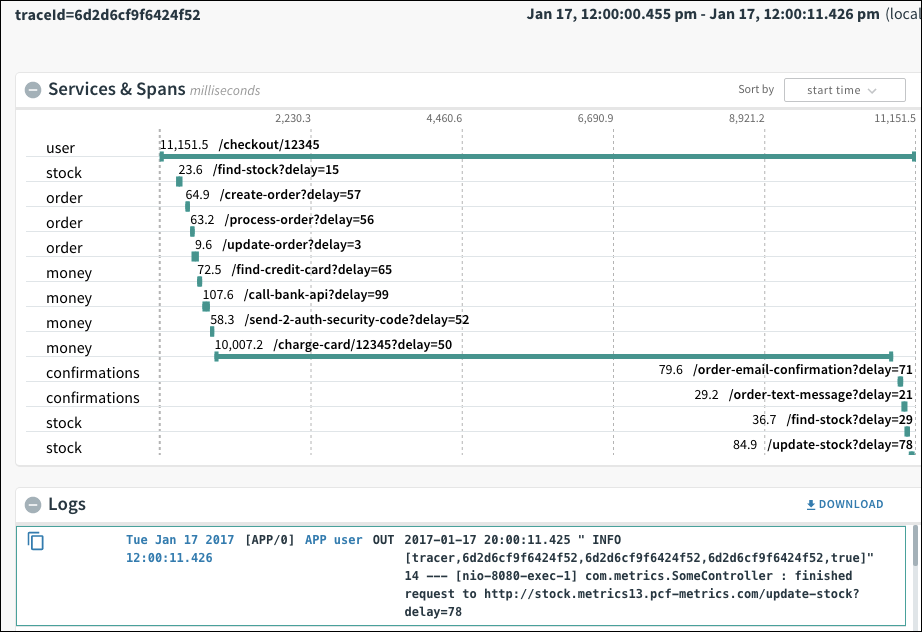 A request corresponds to a single trace ID displayed in the top left corner. Each row includes an app in the left column and a span in the right column. A span is a particular endpoint within the app and the time it took to execute in milliseconds. By default, the graph lists each app and endpoint in the order they were called.
 Note: If you do not have access to the space for an app involved in the request, you cannot see the spans or logs from that app.
- You can click a span to show only logs from that span or any number of spans to toggle which logs appear. Clicking a span also creates a box with that particular span ID in the Logs view:
- If you click
APP APP-NAMEwithin a log, PCF Metrics returns you to the dashboard view for that app, with the time frame focused on the time of the log that you clicked from.
