


This topic describes how to access and use yourHealthwatch™ for VMware Tanzu® v2.2 (Healthwatch) dashboards in the Grafana user interface (UI).
Overview of Healthwatch Dashboards in the Grafana UI
Healthwatch uses Grafana to visualize metrics data in charts and graphs. Once you have installed and configured the Healthwatch and Healthwatch Exporter tiles, you can log in to the Grafana UI to view dashboards that show how your Ops Manager foundations are performing.
Each dashboard contains charts and graphs called panels. Each dashboard and panel contains detailed descriptions of the metrics they display and how to troubleshoot your Ops Manager foundations based on those metrics.
Using Dashboards in the Grafana UI
The diagram below shows a dashboard in the Grafana UI:
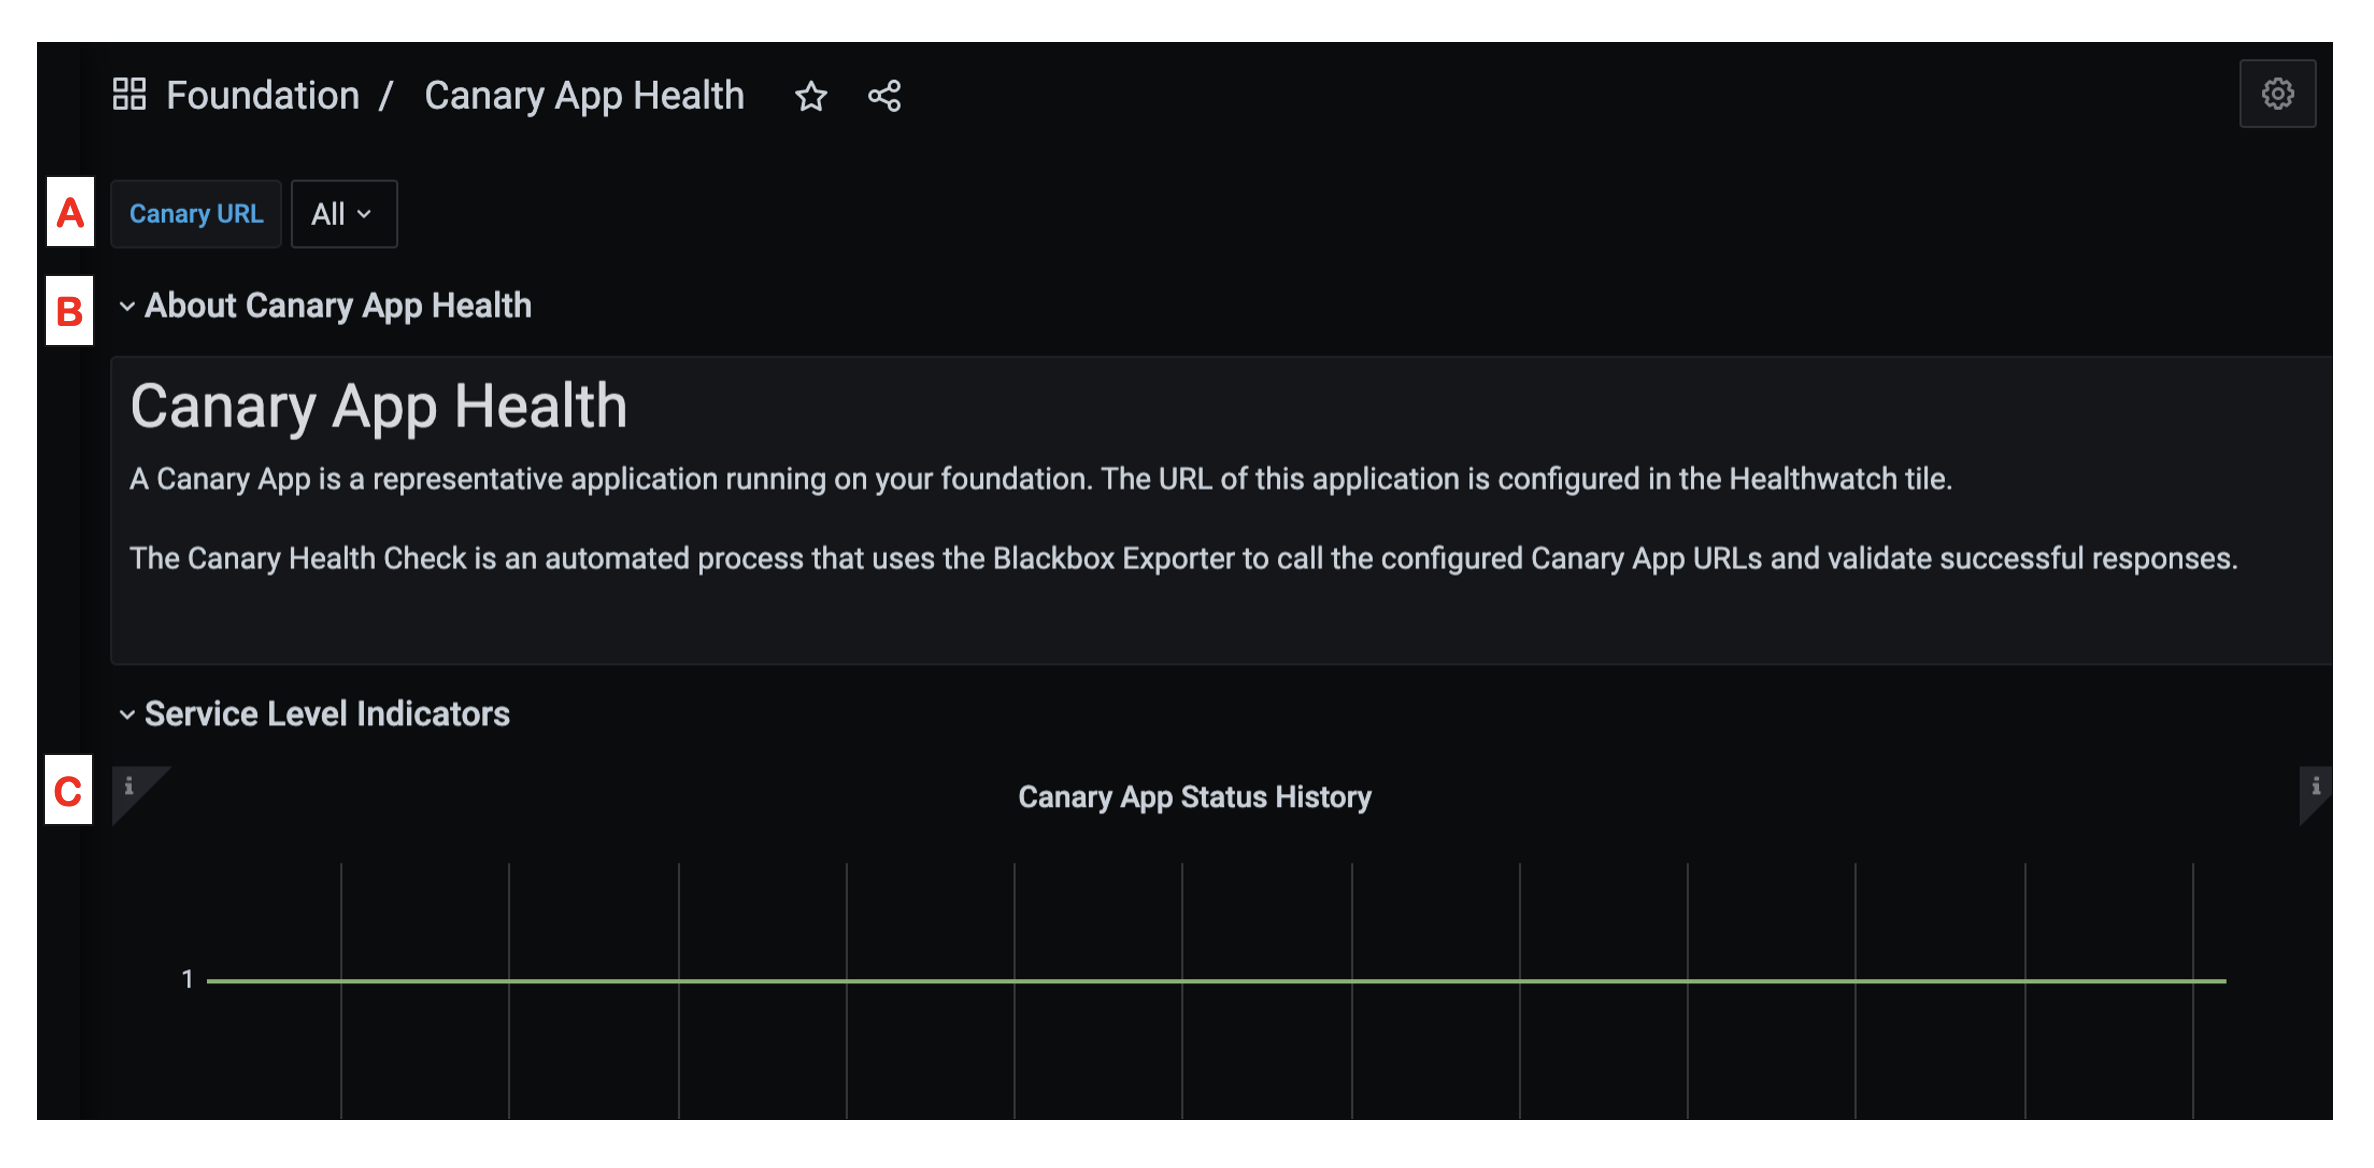
The following list describes each labeled section of the dashboard:
-
A - Filters: Use these dropdowns to filter the metrics that the dashboard displays. Not all dashboards have filters.
-
B - Dashboard Header: Click this header to see a description of the metrics that the dashboard displays, how to use those metrics for troubleshooting, and links to further documentation.
-
C - Information Icon: Hover over this icon to see a description of the metrics that the panel displays and how to use those metrics for troubleshooting.
You can edit a dashboard by copying the dashboard and editing the dashboard copy. To further customize your dashboards, see the Grafana documentation.
View Your Healthwatch Dashboards
To view your Healthwatch dashboards:
-
In your web browser, navigate to the URL that you configured in the DNS entry for the Grafana instance. For more information, see Configuring DNS for the Grafana Instance.
-
Follow one of the procedures below to log in to the Grafana UI, according to the authentication method you configured in the Healthwatch tile:
- Basic authentication: To log in to the Grafana UI using basic authentication:
- Enter the following login credentials:
- For Email or username, enter
admin. - For Password, enter the password for the Grafana UI that you find in the Healthwatch tile. To find the password for the Grafana UI:
- Navigate to the Ops Manager Installation Dashboard.
- Click the Healthwatch tile.
- Select the Credentials tab.
- In the Admin Login Password row of the Grafana section, click Link to Credential.
- Record the value of
password. This value is the password that all users must use to log in to the Grafana UI.
- For Email or username, enter
- Click Log in.
- Enter the following login credentials:
- Generic OAuth: On the Grafana UI login page, click OAuth to log in with your OAuth credentials.
- UAA: On the Grafana UI login page, click UAA to log in with your UAA credentials.
- LDAP: On the Grafana UI login page, click LDAP to log in with your LDAP credentials.
For more information about configuring an authentication method for the Grafana UI, see Configuring Grafana Authentication.
- Basic authentication: To log in to the Grafana UI using basic authentication:
-
On the left side of the Grafana UI homepage, hover over the Dashboards icon on the menu bar. A navigation menu appears.
-
Click Manage. A list of folders appears.
-
View the dashboards in each folder in one of the following ways:
- Click either the name or the expansion arrow on a folder to expand a list of the dashboards it contains.
- Click Go to folder next to a folder name to navigate to the folder page.
- Click the list icon to view a single list of all dashboards contained in all folders. The folder icon is selected by default and groups your dashboards by folder in expandable and collapsible lists.
-
Click a dashboard name to open it.
For detailed descriptions of each default dashboard in the Grafana UI, see Default Dashboards in the Grafana UI below.
Default Dashboards in the Grafana UI
There are 33 total dashboards that Healthwatch creates in the Grafana UI by default. The subsets of these dashboards that appear in the Grafana UI depend on which tiles in your Ops Manager foundations you have installed and are monitoring.
The following list describes the default Healthwatch dashboards you may see in the Grafana UI:
-
Foundation: Includes the following dashboards:
- All Jobs: Contains metrics related to the percentage of healthy VMs in your BOSH Director, runtime, Healthwatch, and Healthwatch Exporter tile deployments. You can filter these metrics by deployment.
- BOSH Director Health: Contains metrics related to the health of the BOSH Director.
- Canary App Health: Contains metrics related to the availability of the canary app that the Blackbox Exporter uses to run canary tests. You can filter these metrics by canary URL.
- Certificate Expiration: Contains metrics related to when certificates for your Ops Manager deployment are due to expire. For more information, see Monitoring Certificate Expiration.
- Job Details: Contains metrics related to the functionality of each component and VM in your runtime, Healthwatch, and Healthwatch Exporter tile deployments. You can filter these metrics by health status, deployment, job instance, and VM. If your Ops Manager foundation has neither VMware Tanzu Application Service for VMs (TAS for VMs) or VMware Tanzu Kubernetes Grid Integrated Edition (TKGI) installed, you see this dashboard upon logging in to the Grafana UI.
- Ops Manager Health: Contains metrics related to the availability of your Ops Manager deployment.
- System at a Glance: Contains an overview of metrics related to the health of your Ops Manager deployment. You see this dashboard upon logging in to the Grafana UI.
-
Healthwatch: Includes the following dashboards:
- Healthwatch - Exporter Troubleshooting: Contains metrics related to the functionality of the metric exporter VMs that Healthwatch Exporter for VMware Tanzu Application Service for VMs (TAS for VMs) deploys.
- Healthwatch SLOs: Contains metrics related to the availability of runtime, Healthwatch, and Healtwatch Exporter tile components. You can filter these metrics by uptime service level objective (SLO) target.
-
MySQL: Includes the following dashboard:
Note: This folder only appears if you configure Healthwatch to monitor your Tanzu SQL for VMs tile. For more information, see (Optional) Configure Grafana Dashboards in Configuring Healthwatch.
- MySQL Overview: Contains metrics related to the percentage of healthy VMware Tanzu SQL with MySQL for VMs (Tanzu SQL for VMs) clusters and nodes in your deployment.
-
RabbitMQ: Includes the following dashboards:
Note: This folder only appears if you configure Healthwatch to monitor your Tanzu RabbitMQ tile. For more information, see (Optional) Configure Grafana Dashboards in Configuring Healthwatch.
- Erlang-Distribution: Contains metrics related to the functionality of distribution links between VMware Tanzu RabbitMQ for VMs (Tanzu RabbitMQ) nodes and peers. You can filter these metrics by namespace, Tanzu RabbitMQ cluster, and process type.
- Erlang-Distributions-Compare: Contains metrics related to comparing the functionality of distribution links between Tanzu RabbitMQ nodes and peers. You can filter these metrics by namespace, Tanzu RabbitMQ cluster, PerfTest instance, percentile, host, and container.
- Erlang-Memory-Allocators: Contains metrics related to the functionality of your Tanzu RabbitMQ memory allocators. You can filter these metrics by namespace, Tanzu RabbitMQ cluster, Tanzu RabbitMQ node, and Erlang memory allocator.
- RabbitMQ Clusters Overview: Contains metrics related to the percentage of healthy nodes across all Tanzu RabbitMQ clusters.
- RabbitMQ-Overview: Contains metrics related to the functionality of your Tanzu RabbitMQ cluster nodes. You can filter these metrics by namespace and Tanzu RabbitMQ cluster.
- RabbitMQ-PerfTest: Contains metrics related to the functionality of the PerfTest instances in your Tanzu RabbitMQ clusters. You can filter these metrics by PerfTest instance and percentile.
- RabbitMQ-Quorum-Queues-Raft: Contains metrics related to the functionality of the quorum queues in your Tanzu RabbitMQ clusters. You can filter these metrics by namespace and Tanzu RabbitMQ cluster.
-
Tanzu Application Service: Includes the following dashboards:
Note: This folder only appears if you install and configure Healthwatch Exporter for TAS for VMs on one or more of your Ops Manager foundations. For more information about Healthwatch Exporter for TAS for VMs, see Healthwatch Exporter for TAS for VMs Architecture in Healthwatch Architecture and Configuring Healthwatch Exporter for TAS for VMs.
- App Instances: Contains metrics related to the number and functionality of apps and tasks running on your TAS for VMs deployments.
- CLI Health: Contains metrics related to the functionality of the Cloud Foundry Command-Line Interface (cf CLI).
- Diego/Capacity: Contains metrics related to the capacity of all Diego Cells in your TAS for VMs deployments. You can filter these metrics by memory chunk size and disk size.
- Logging and Metrics Pipeline: Contains metrics related to the health and functionality of the Firehose in your TAS for VMs deployments.
- Router: Contains metrics related to the health and functionality of the Gorouters in your TAS for VMs deployments.
- Tanzu Application Service SLOs: Contains metrics related to the availability of the
cf pushcommand and the canary apps for your TAS for VMs deployments. You can filter these metrics bycf pushuptime SLO target and canary app uptime SLO target. - TAS MySQL Health: Contains metrics related to the health of the MySQL databases for your TAS for VMs deployments.
- UAA: Contains metrics related to the health and functionality of the UAA instances in your TAS for VMs deployments.
- Usage Service: Contains metrics related to the health and functionality of the UAA instances in your TAS for VMs deployments.
Note: If you do not see any data in the Usage Service dashboard, make sure that you have configured the Metric Registrar in the TAS for VMs tile. If you do not configure the Metric Registrar, the Usage Service API cannot emit metrics to the Loggregator Firehose, and Healthwatch Exporter for TAS for VMs cannot collect them. For more information, see the TAS for VMs documentation.
-
Tanzu Kubernetes Grid Integrated: Includes the following dashboards:
Note: This folder only appears if you installed and configured Healthwatch Exporter for Tanzu Kubernetes Grid Integrated Edition (TKGI) on one or more of your Ops Manager foundations. For more information about Healthwatch Exporter for TKGI, see Healthwatch Exporter for TKGI Architecture in Healthwatch Architecture and Configuring Healthwatch Exporter for TKGI.
- Kubernetes API Server: Contains metrics related to the functionality of the Kubernetes API Server instances in your TKGI clusters. You can filter these metrics by cluster and instance.
- Kubernetes Cluster Detail: Contains metrics related to the functionality of the nodes in your TKGI clusters. You can filter these metrics by cluster. If your Ops Manager foundation has only TKGI installed, you see this dashboard upon logging in to the Grafana UI.
- Kubernetes Clusters Overview: Contains metrics related to the percentage of healthy control plane nodes across all TKGI clusters.
- Kubernetes Controller Manager: Contains metrics related to the functionality of the Kubernetes Controller Manager instances in your TKGI clusters. You can filter these metrics by cluster and instance.
- Kubernetes Etcd: Contains metrics related to the functionality of the etcd instances in your TKGI clusters. You can filter these metrics by cluster and instance.
- Kubernetes Nodes: Contains metrics related to the functionality of your TKGI cluster nodes. You can filter these metrics by cluster and instance.
- Kubernetes Scheduler: Contains metrics related to the functionality of the Kubernetes Scheduler instances in your TKGI clusters. You can filter these metrics by cluster and instance.
- TKGI Control Plane: Contains metrics related to the functionality of the TKGI Control Plane.
