


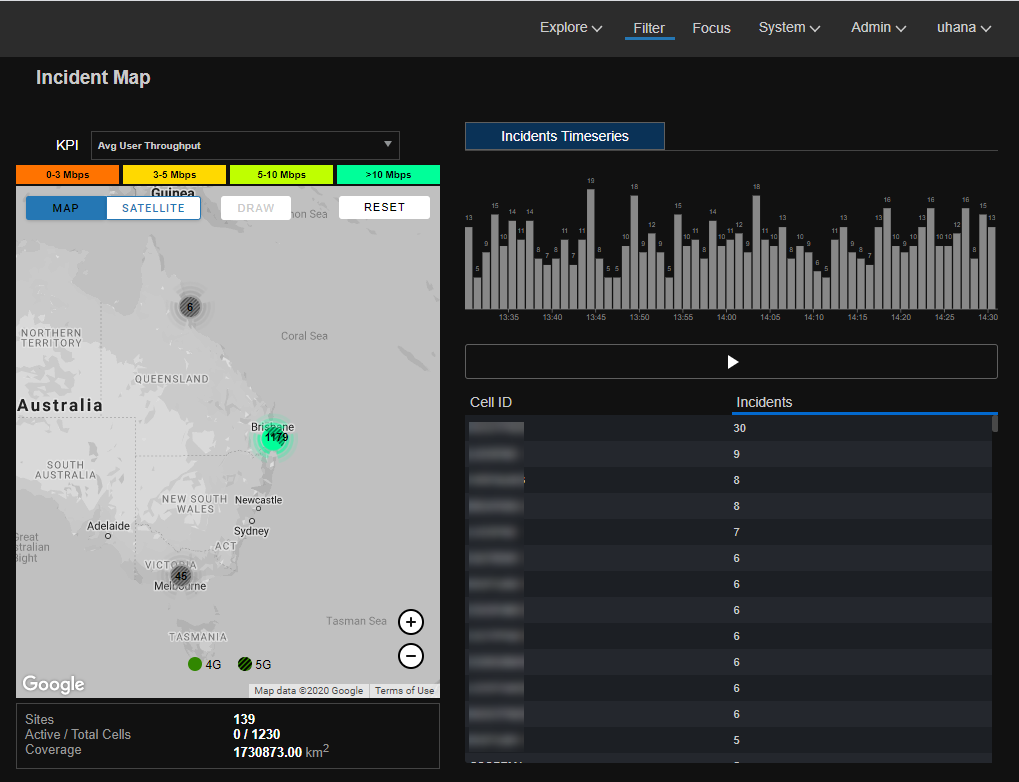
The Filter page provides the ability to filter KPIs on threshold-based criteria. The output is a list of cells ordered by the number of times the criteria was satisfied. This allows a user to quickly identify interesting cells in the network for additional KPI investigation.
The following topics describe how to use the Filter page.
Use the selection panel
The selection panel is the same as the Explore page. See Use the selection panel for details.
Use the map
The map is the same as the Explore page. See Use the map for details.
Define filtering criteria
The KPI drop-down menu above the map can be used to define one or more filtering criteria. The default criterion is set to Avg User Throughput less than (<) 3 Mbps. Forming a filtering criteria requires setting the following items.
- KPI - Select a KPI for filtering. The KPIs supported currently include Active downlink UEs, Agg Spectral Efficiency, Avg Cell Throughput, Avg User Throughput, Cell CCE Utilization, and Cell DL PRB Utilization. See Cell KPI definitions for KPI definitions
- Operator - Select the KPI threshold; greater than (>), less than (<), or equal to (=)
- Threshold - Specify a numeric threshold for the KPI
- QCI - Specify if the KPI needs to be computed for a specific QCI or for All QCIs
After the above items have been specified, you can choose to add another criteria by clicking on + add criteria. Follow the above steps to add another criteria. Note that this defines a logical AND conditional operation between the criteria. No other conditional operations are currently supported. After finishing defining the criteria, click Apply. This would update the Incident Timeseries chart and the Incidents table.
Use incident list
The incident list provides a list of cells that satisfied the filtering criteria ordered by the number of times the criteria was satisfied per cell. This list can quickly help identify interesting cells. Once the cells are identified, click on a cell of interest to go to cell data charts.
The incident timeseries chart above the incident list provides a timeseries view of the number of cells that satisfied the filtering criteria at least once. You can select the play button to cycle through the timeseries chart and watch the associated cells and incident data change in the incidents list.
Some sample use cases for the Filter page are provided below.
- Find cells with poor user throughput (below 3 Mbps): This is the default view and lists the cells that experience poor downlink user throughput. Select a cell that is reporting these incidents and go to the Explore page to correlate whether poor throughput is related to heavy load or poor radio conditions.
- Find cells where QoS criteria is not satisfied, for instance, throughput for QCI 6 is below 1 Mbps: Define the filtering criteria as Avg User Throughput < 1 for QCI 6 and click Apply. Select a cell that is reporting such incidents, go to the Explore page and to the QCI view for additional investigation.
- Find cells where heavy total control channel usage exists but has low control channel usage from QCI 6: Define the filtering criteria as Cell CCE Utilization > 60 for QCI All AND Cell CCE Utilization < 20* for QCI 6, as an example. This criteria can help identify where QCI 6 users can potentially be impacted because of heavy control channel load.
