


Investigate findings from VMware Aria Automation for Secure Clouds to discover and close vulnerabilities in your organization
Findings are the cornerstone of action in the VMware Aria Automation for Secure Clouds platform. Every individual finding corresponds to a monitored cloud account resource, and is generated any time the service detects a configuration state on a cloud resource that violates an active security rule. Findings can come from several sources, but are broadly distinguished as follows:
- Native findings are generated directly from the service and correspond to security rules created and maintained by the development team.
- Third-party findings are generated by external services such as Amazon GuardDuty or Microsoft Defender for Cloud, then ingested into the service through an inbound integration. See Third-party findings for more details.
This guide provides an overview of actions you can take to review, filter, and resolve findings, and how to integrate and highlight third-party findings from supported services.
Reviewing findings
VMware Aria Automation for Secure Clouds generates a finding any time it detects a misconfiguration or security event in a monitored cloud resource. A finding is reported only once for the specific resource and conditions that generated it and remains open until it is resolved.
To review your findings:
Select the Findings tab from the console.
Select a view:
- Findings (all) - Shows all individual findings. Use this when you're searching for specific specific issues.
- Findings by rule - Shows all active rules with at least one associated finding. Use this view when researching the incidence of a specific type or family of violations across your organization.
- Findings by resource - Shows all cloud resources with at least one associated finding. Use this view when you want to to visualize and break down the risk of specific resources.
Apply any additional sorting or filters to fit your review criteria.
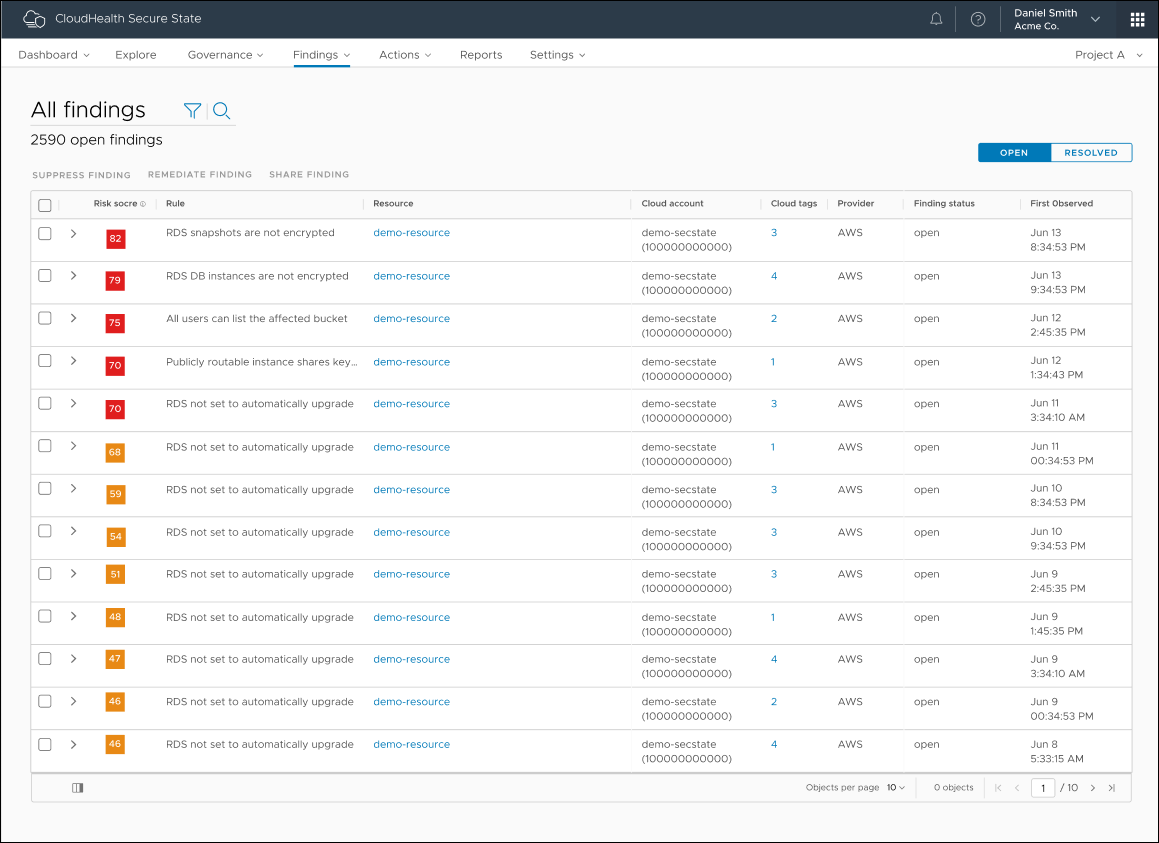
All open findings are displayed by default. You can the change the view from Open to Resolved in the upper right to see any findings that are closed. A finding becomes resolved when you correct the misconfiguration that generated it.
Understanding findings
Review each topic to learn more about a different element of findings: the content on the details page, the available finding types, and the finding risk score.
Finding details
The findings detail page provides in-depth information about a finding you can use during investigation and resolution. You can reach this page by clicking the link under the Resource column for any finding, if one is available.
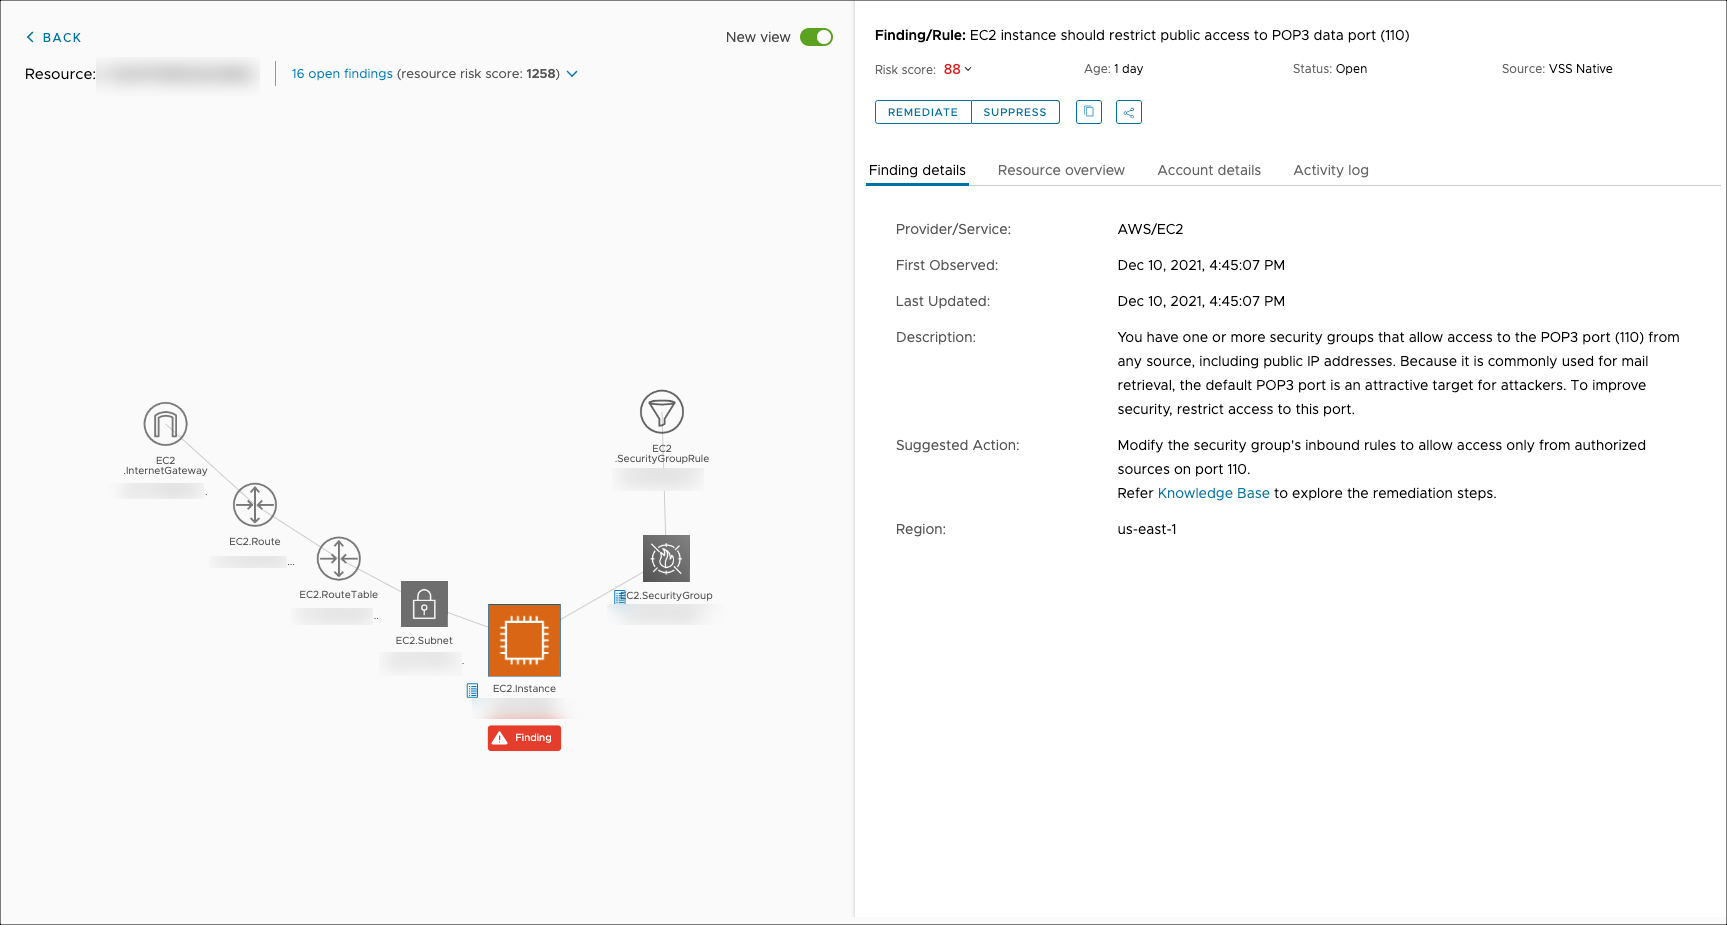
The left panel displays a visualization of the resource that triggered the finding and connected resources to better understand security impact. If the resource has multiple findings, you can view them by clicking the drop-down menu where it says "X open findings" (5 in this case).
The right panel displays in-depth data for the finding, including:
- Age: Displays the number of the days passed after the finding was first detected.
- Actions: These icons are directly beneath the risk score for quick action on the finding if necessary.
- Resource overview: Click this tab to see metadata related to the resource such as type, region, provider, and any tags.
- Account details: If the resource owner entered their name and email when onboarding, you can find it. This is useful for tracking down the right person to fix the finding if you're monitoring an organization as part of a central security team.
- Activity log: System-generated events like state changes or API calls for logging services are captured by the activity log and can help you verify root cause on a violation.
Finding types
The following are the types of findings supported by VMware Aria Automation for Secure Clouds.
Anomaly
BETA FEATURE: Anomalies are in private beta for AWS cloud accounts. Reach out to your customer success team if you have questions about participation.
An anomaly is a finding type that indicates suspicious or uncommon activity on a resource. Anomalies are often generated based on a cloud entity's activity history, but this doesn't necessarily indicate a security problem. Rather, it presents an opportunity to investigate and verify whether the anomaly constitutes malicious activity.
To receive anomalies, CloudTrail must be enabled for all the regions in which you are monitoring resources with VMware Aria Automation for Secure Clouds. Anomalies are detected after 7 days for a new organization, and within two hours for any new cloud accounts after that.
There are two kinds of scenario where an anomaly is generated:
Unknown access - In this scenario, the service generates an anomaly in real time when a resource is accessed by an entity that has not been observed on that resource in the past 90 days. New IP addresses are a common example of this anomaly type.
Anomalous behavior - In this scenario, the service generates an anomaly when an entity's activity on a resource exceeds an established baseline for occurrence of that activity. Making a large number of S3 bucket read requests over a short period of time is an activity that could generate an anomaly. The service scans for anomalous activity on an hourly and daily basis.
Unlike other findings, anomalies are view-only. This means they do not resolve based on user activity in the cloud. Instead, you must investigate the event that generated an anomaly and verify whether a security violation occurred. If you find the event was legitimate access, go the findings detail page for the anomaly and select Mark false positive. This changes the finding status from Open to Resolved. Otherwise, follow the remediation steps in the knowledge base link to ensure further anomalies aren't generated. An anomaly is automatically removed after 90 days but can re-occur if the activity repeats.
Here are the current anomalies available for the private beta.
Threat
BETA FEATURE: Threats are in public beta for AWS cloud accounts. Reach out to your customer success team if you have questions about them as written.
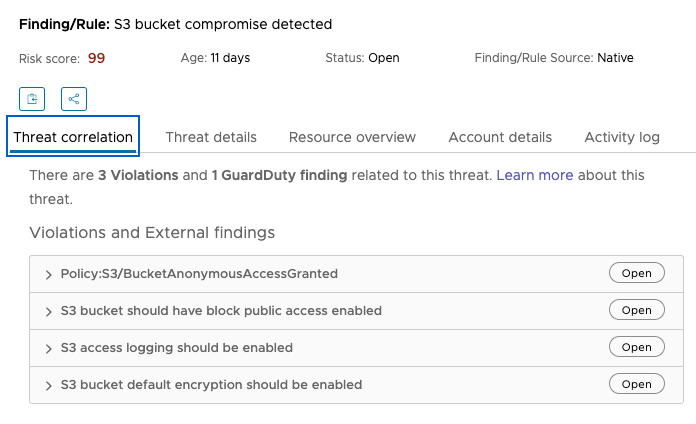
Threats indicate that a resource has become compromised through either malicious or negligent action. The responsible party must take immediate steps to isolate and investigate any resource with an active threat. All threats have a Critical severity and a risk score of 99.
A threat is generated when a specific combination of native and third-party violations are detected on the same resource. Because of the reliance on third-party violations to assess a threat, a cloud account must have an active Amazon GuardDuty integration to benefit from threat detection.
You can resolve a threat by closing out the associated findings, also known as the threat correlation. The following is an example of the threat correlation tab on the findings detail page.
Here are the current threats available for public beta.
Violation
A violation is a finding that correlates to a specific misconfiguration on a cloud resource. The vast majority of the findings detected by VMware Aria Automation for Secure Clouds are likely to be violations, as that is the scope of most of the rules created for each provider.
You resolve a violation by correcting the resource configuration that generated it. Some violations are automatically resolved through the remediation service, when configured.
Vulnerabilities
A vulnerability is an external finding associated with the Amazon Inspector integration. See the Amazon Inspector integration documentation for more information about these types of findings.
Finding risk score
The risk score is the primary and most visible element VMware Aria Automation for Secure Clouds offers to help users prioritize and mitigate their findings. Risk scores for individual findings range from a value of 10 to 99 and are calculated from two key metrics.
The first metric is the severity of the rule that triggered the finding. Severity is qualitatively assigned when a rule is created based on industry standards, and has a value of Low, Medium, High, or Critical.
Note: The Critical severity is only assigned to threat-type findings.
The potential impact each severity value has on risk score is represented through three defined score ranges:
| Severity | Minimum Risk Score | Maximum Risk Score |
|---|---|---|
| Low | 10 | 39 |
| Medium | 40 | 69 |
| High | 70 | 99 |
Some caveats with these values:
- Risk score begins at 10 because lower values are difficult to justify as violations at all.
- Base value ranges and algorithmic calculations are subject to change as the development team continues to update and enhance the service.
The second metric is the number of other resources affected by the finding. This is calculated based on how many resources there are within two degrees, or "hops", from the violating resource. To better visualize this concept, see this image taken from an Explore query:
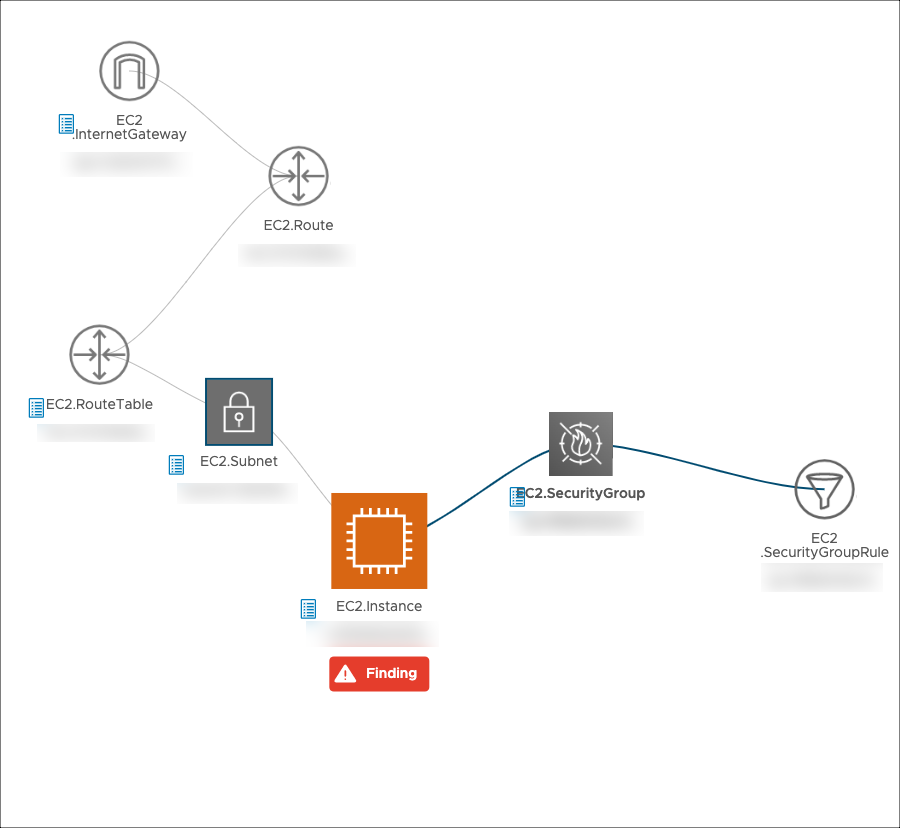
In this example, the first hop from the violating EC2 instance includes a security group and a subnet, while the second hop includes a route table and security rule connected the resources from the first hop. In production these numbers are expected to be much higher - an analysis of 10,000 violations found the average range of connected resources was 0–62 for the first hop, and 0–1520 for the second hop.
A proprietary algorithm calculates the final risk score from these two metrics. The goal of the algorithm is to appropriately weight the first and second hop connected resources to distribute the risk score and avoid risk score clustering across the findings.
Filtering findings
From any findings page, click the filter icon next to the title to display the filter menu in a sidebar. Use the options available to prioritize the kinds of findings you want to see when viewing security results for your organization, project, or cloud account. The choices you make are stored and carried over to other findings views you can choose, until you select "Clear All" in the filter menu or close the browser tab.
Available filtering options include:
Finding Source
Displays findings only from the selected source. This distinguishes between native findings and findings from external sources, like Amazon GuardDuty.
Provider
Displays findings only from the selected providers, such as Amazon Web Services or Azure.
Framework
Displays findings only from rules that are mapped to selected compliance frameworks, like CIS AWS Foundations Benchmark or EU GDPR.
Cloud Account Name / ID
Displays findings only from the cloud accounts selected. You can combine cloud accounts from different providers.
Environment
Displays findings only from cloud accounts in selected environments, like development or production.
Risk Score
Displays finding only within the risk score range you specify.
Severity
Displays findings only within the severity you choose (Low, Medium, or High).
Service
Displays findings only from the cloud provider services you specify, such as AWS EC2 or Azure Compute. You can combine multiple services from different cloud providers.
Region
Displays findings only from cloud accounts in the regions you specify, like Azure East US or GCP europe-west1. You can combine multiple regions from different cloud providers.
Cloud Tag
Displays findings only from cloud accounts associated with the cloud tags you select. The list automatically populates with any cloud tags that are in use.
Finding Age/Found On
This filter category defines two different metrics to filter by:
- Finding Age - The number of days passed after the finding was detected.
- Found On - How long ago the finding was detected.
To demonstrate the difference, you can select "Age more than 30 days" to show only those findings that are 30 days old or more. Alternatively, you can select "Found on last 7 days" to only show findings that were detected in the past week. Although similar, these custom date range examples demonstrate situations where either filter type might be more useful:
- Setting a custom Finding Age range of more than 30 days and less than 90 days helps you see all the findings in a time period that is otherwise difficult to define with the Found On filter.
- Setting a custom Found On date range of January 25th to January 27th helps if knowing what findings occurred on those specific dates is important, and is easier to verify than using the Finding Age custom range.
Resolving Findings
You can resolve a finding by closing the violation or misconfiguration that triggered it. You can either do this directly in your cloud provider's console, or by running a remediation action from the VMware Aria Automation for Secure Clouds console, if you configured one.
Resolve findings through the console
Most findings must be resolved through your cloud provider's portal. Review the finding's knowledge base article for step-by-step instructions on how to fix to finding in your cloud provider's portal and resource links to relevant cloud provider documentation.
Select the drop-down menu icon next to the finding.
Click the View knowledge base link.
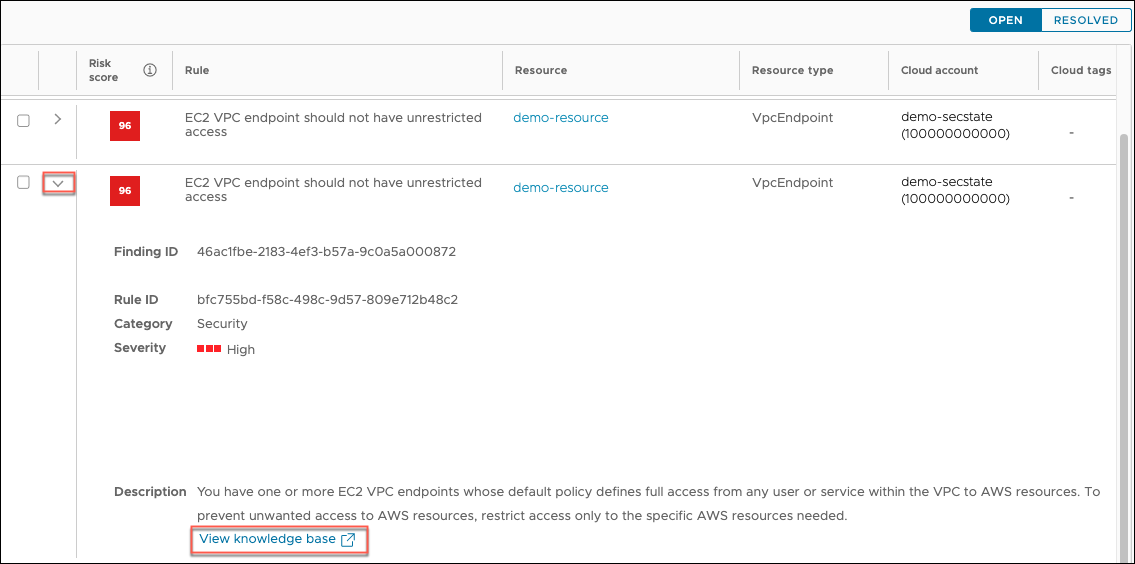
Review the knowledge base (KB) article for the recommended actions to resolve the finding.
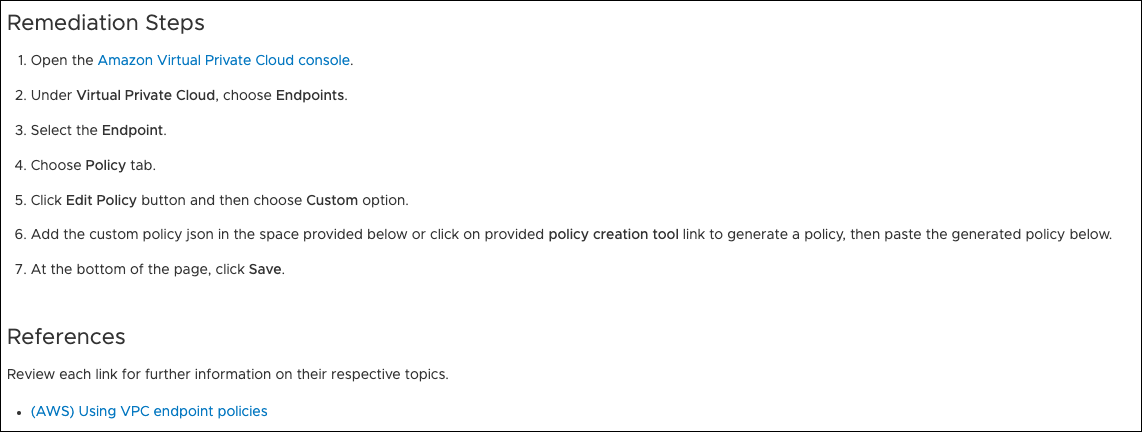
If remediation steps aren't available directly from the KB article, you can review the provider documentation linked in the references section.
Resolve findings through the remediation service
You can resolve a finding automatically through the remediation service if it meets the following criteria:
- The finding is on an AWS or Azure resource.
- The finding derives from a rule that supports remediation actions.
- You deployed a remediation worker in your cloud provider with the necessary permissions to access the violating cloud account.
- You created a corresponding remediation action under Actions > Remediations to perform the task.
See the Remediation guide for instructions for each step. For a list of rules that support remediation, see the Remediation Github Repository.
Suppressing findings
Suppression is an alternative to resolving a finding, and is suggested when you cannot (or don't need to) fix a particular finding, but don't want to see it in your results, notifications, or dashboard widgets. Suppressed findings are removed from common views while still being tracked and maintained with relevant metadata (time discovered, cloud account, resource, and so on) for later review.
Review the Suppression guide for more details about requesting suppressions for findings.
Third-party findings
A third-party finding originates from a service other than VMware Aria Automation for Secure Clouds. You can use third-party findings alongside native findings to build a more comprehensive view of your cloud security posture without needing to review and compile results from multiple dashboards. At this time, third-party findings are available through the Amazon GuardDuty, Amazon Inspector, and Microsoft Defender for Cloud integrations.
Amazon GuardDuty
When you onboard a new AWS cloud account, the service automatically pre-configures an Amazon GuardDuty integration for you. This integration is not active by default, and must be enabled take advantage of third-party findings from Amazon GuardDuty.
Detailed instructions for onboarding an AWS account are available at the AWS Onboarding Guide. To enable the Amazon GuardDuty integration with a new account:
- Navigate to Settings > Cloud accounts and select Add New.
- Enter the required information and proceed to the next page.
- Follow the directions provided and click the Enable toggle for Amazon GuardDuty listed at the end of page.
- Follow the remaining directions to onboard your cloud account.
You can also enable the integration after onboarding by going to Settings > Integrations > Amazon GuardDuty > View Details. From here you can turn the Amazon GuardDuty integration on or off for any active AWS cloud account.
If you don't see the Amazon GuardDuty integration for your account, and you recently onboarded it, wait a few minutes for it to populate. If time passes and you still don't see it, remove and onboard the account again.
Reviewing findings from Amazon GuardDuty
You can review Amazon GuardDuty findings alongside native findings in the Findings tab. Use a filter to highlight them:
- Go to any view from the Findings tab and click the filter icon.
- Select Finding Source from the filter menu.
- Click Amazon GuardDuty, then click Apply.
- To see specific details for a finding, click the resource, then select the External source details tab on the right panel.
If you're not seeing any findings, verify Amazon GuardDuty is enabled for the appropriate account in your AWS console, and that at least one finding is detected.
NoteThe GuardDuty integration only reports genuine findings to the service. Sample findings generated in GuardDuty for testing purposes aren't detected by the integration.
Amazon Inspector
Amazon Inspector scans instances, container images, and other resources for software and network vulnerabilities. Review the Amazon Inspector integration page for specific instructions on configuration.
Microsoft Defender for Cloud
When you onboard a new Azure subscription, the service automatically pre-configures a Microsoft Defender for Cloud integration for you. This integration is not active by default, and must be enabled take advantage of third-party findings from Microsoft Defender for Cloud.
Detailed instructions for onboarding an Azure subscription are available at the Azure Onboarding Guide. To enable the Microsoft Defender for Cloud integration with a new cloud account:
- Navigate to Settings > Cloud accounts and select Add New.
- Enter the required information and proceed to the next page.
- Follow the directions provided and click the Enable toggle for Microsoft Defender listed at the end of page.
- Follow the remaining directions to onboard your cloud account.
You can also enable the integration after onboarding by going to Settings > Integrations > Microsoft Defender > View Details. From here you can turn the Microsoft Defender integration on or off for any active Azure cloud account.
If you don't see the Microsoft Defender integration for your account, and you recently onboarded it, wait a few minutes for it to populate. If time passes and you still don't see it, remove and onboard the account again.
Reviewing findings from Microsoft Defender for Cloud
You can review Microsoft Defender findings alongside native findings in the Findings tab. Use a filter to highlight them:
- Go to any view from the Findings tab and click the filter icon.
- Select Finding Source from the filter menu.
- Click Microsoft Defender for Cloud and click Apply.
- To see specific details for a finding, click the resource, then select the External source details tab on the right panel.
If you're not seeing any findings, verify Microsoft Defender is enabled for the appropriate subscription in your Azure console, and that at least one finding is detected.
GCP Security Command Center
GCP Security Command Center scans projects and reports findings for misconfigurations, vulnerabilities, and other threats. Review the GCP Command center integration page for specific instructions on configuration.
Adding a third-party finding to a rules filter
When creating an alert, report, or suppression, you can include one or more rules as part of the criteria the service uses to filter results. This includes both native and third-party rules, with two differences:
- Predictive text is not available when creating a rules filter from a third-party source.
- Text is not validated when creating a rules filter from a third-party source.
This means you must ensure the third-party finding is accurate on entry. To reduce errors, it's best to copy the text from a third-party finding and paste it directly into the rules field.
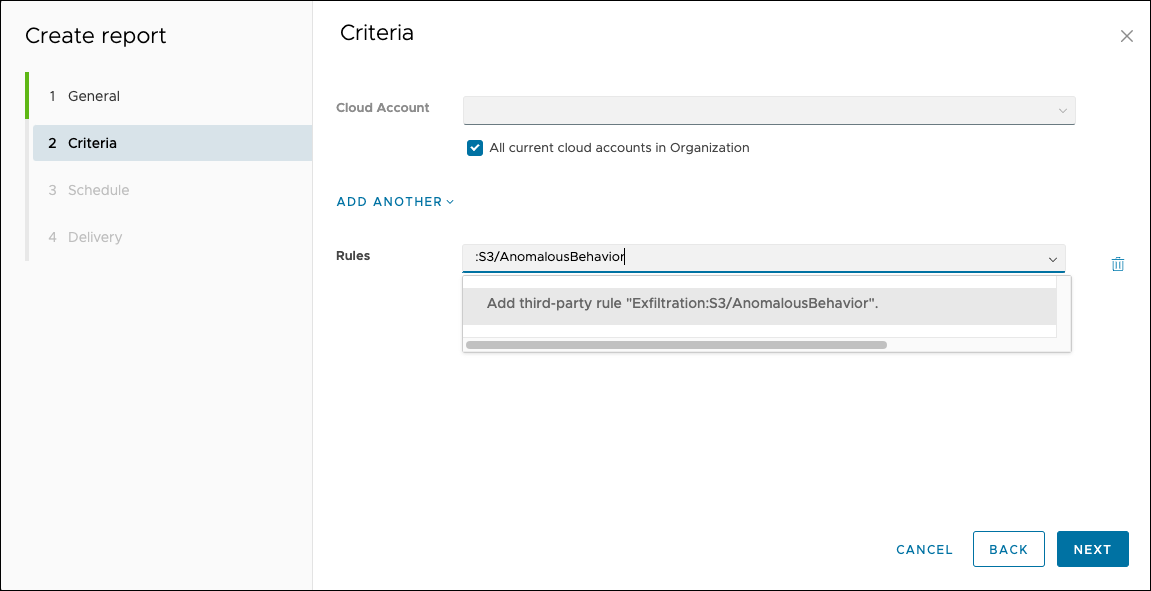
The image demonstrates creating a report for all Amazon GuardDuty Exfiltration:S3/AnomalousBehavior findings in an organization. You can do the same for suppressions or alerts.
