


As an Automation Service Broker consumer, you use the Deployments page to manage your deployments and the associated resources, making changes to deployments, troubleshooting failed deployments, making changes to the resources, and destroying unused deployments.
The deployments are the provisioned instances of catalog items, cloud templates, and onboarded resources. If you manage a small number of deployments, the deployment cards provide a graphical view for managing them. If you manage a large number of deployments, the deployment list and the resource list provide more a more robust management view.
To manage your deployments, select .
You can use the Projects drop-down on the Consume tab to view only the deployments for a specific project.
Working with deployment cards and the deployment list
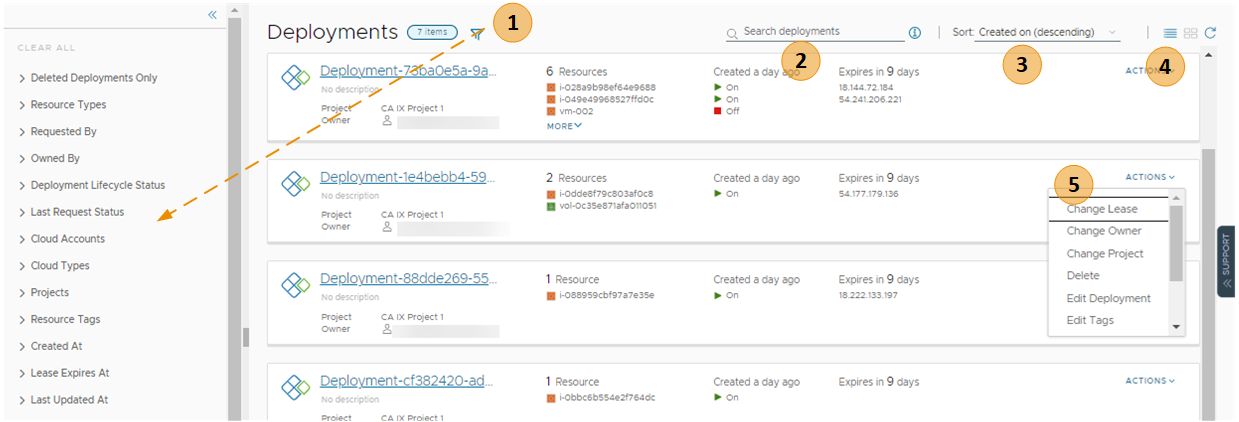
You can locate and manage your deployments using the card list. You can filter or search for specific deployments, and then run actions on those deployments.
- Filter your requests based on attributes.
For example, you can filter based on owner, projects, lease expiration date, or other filtering options. Or you might want to find all the deployments for two projects with a particular tag. When you construct the filter for the projects and tag example, the results conform to the following criteria: (Project1 OR Project2) AND Tag1.
The values that you see in the filter pane depend on the current deployments that you have permission to view or manage.
Most of the filters and how to use them are relatively obvious. Additional information about some of these filters is provided below.
- Search for deployments based on keywords or requester.
- Sort the list to order by time or name.
- Switch between the deployment card and the deployment grid views.
- Run deployment-level actions on the deployment, including deleting unused deployments to reclaim resources.
You can also see deployment costs, expiration dates, scheduled deletion dates, and status.
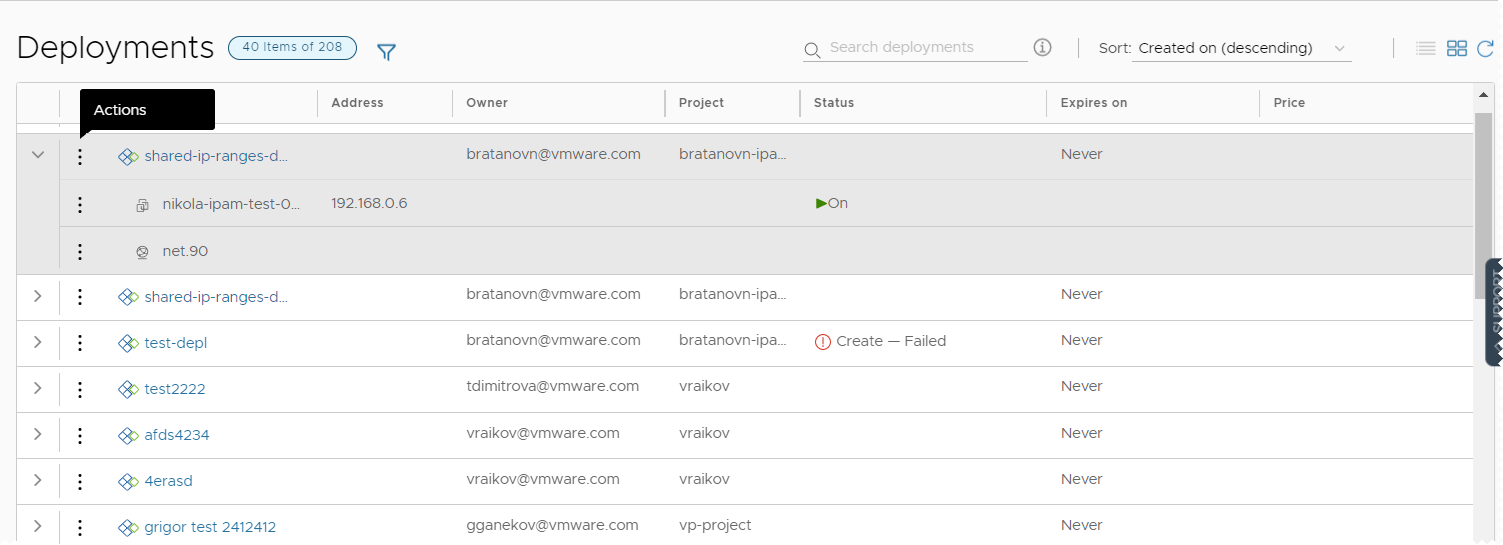
To adjust what information you see for your deployments, click Manage Columns in the bottom left of the deployment grid and select your preferred columns.
You can switch between the card and grid view in the upper right of the page, to the right of the Sort text box. You can use the grid view to manage a large number of deployments on fewer pages.
Working with selected deployment filters
The following table is a not a definitive list of filter options. Most of them are self-evident. However, some of the filters require a little extra knowledge.
| Filter name | Description |
|---|---|
| Optimizable Resources Only | If you integrated VMware Aria Operations and are using the integration to identify reclaimable resources, you can toggle on the filter to limit the list of qualifying deployments. |
| Deployment Lifecycle Status | The Deployment Lifecycle Status and Last Request Status filters can be used individually or in combination, particularly if you manage a large number of deployments. Examples are included at the end of the Last Request Status section below. Deployment Lifecycle Status filters on the current state of the deployment based on the management operations. This filter is not available for deleted deployments. The values that you see in the filter pane depend on the current state of the listed deployments. You might not see all possible values. The following list includes all the possible values. Day 2 actions are included in the Update status.
|
| Last Request Status filters | Last Request Status filters on the last operation or action that ran on the deployment. This filter is not available for deleted deployments. The values that you see in the filter pane depend on the last operations that ran on the listed deployments. You might not see all possible values. The following list is all of the possible values.
The following examples illustrate how the how to use the Deployment Lifecycle Status and Last Request Status filters individually or together.
|
Working with deployment details
You use the deployment details to understand how the resources are deployed and what changes have been made. You can also see pricing information, the current health of the deployment, if the deployment expires and when it's scheduled for deletion, and if you have any resources that need to be modified.
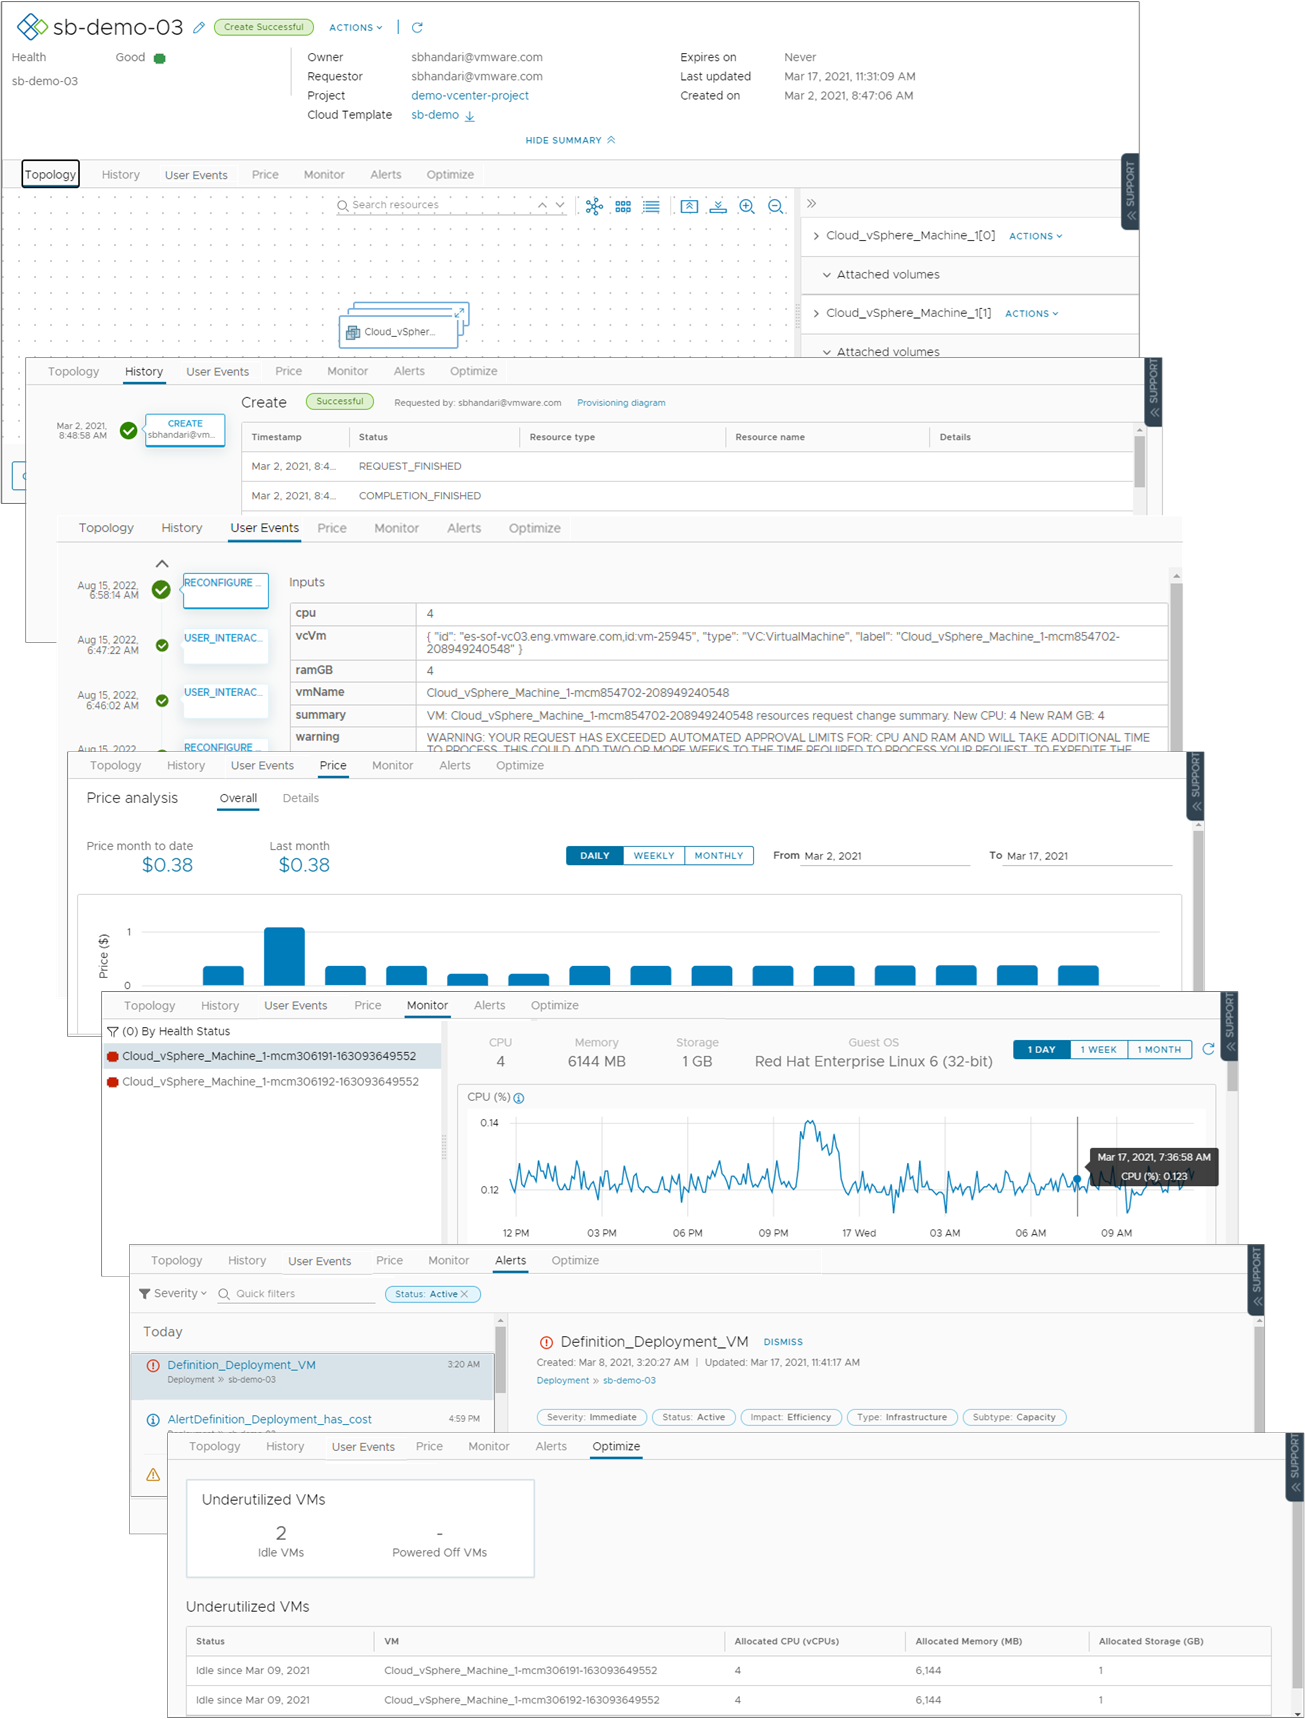
- Topology tab. You can use the Topology tab to understand the deployment structure and resources.
- History tab. The History tab includes all the provisioning events and any events related to actions that you run after deploying the requested item. If there are any problems with the provisioning process, the History tab events helps you with troubleshoot the failures.
- User Events tab. You can use the User Events tab to provide and track the user interactions for your deployment. The events include any initial input values, any required approvals, input values for day 2 changes, and any values that you must provide as part of a deployment or for a day 2 action workflow. Where the request requires input values, you can also enter the values on the Inputs tab in Automation Service Broker.
For deployments that include VMware Aria Automation Orchestrator workflow user events, where you enter values during the deployment process, there are some situations where the tab does not display the form or where the workflow is canceled. If you have multiple VMware Aria Automation Orchestrator instances that do not have tags or where they all have the same tag, the form does not load. Ensure that you correctly tag the instances so that the form displays on the tab. If there are not assignees in the workflow form, the workflow is canceled and the deployment or action fails. Ensure that you workflow form includes assignees.
- Price tab. You can use the pricing tab for insights about how much your deployment is costing your organization. Pricing information is provided by your VMware Aria Operations or CloudHealth integrations.
- Monitor tab. The Monitor tab data provides information about the health of your deployment based on data from VMware Aria Operations.
- Alerts tab. The Alerts tab provides active alerts on the deployment resources. You can dismiss the alert or add reference notes. The alerts are based on data from VMware Aria Operations.
- Optimize tab. The Optimize tab provides utilization information about your deployment and offers suggestions for reclaiming or otherwise modifying the resources to optimize resource consumption. The optimization information is based on data from VMware Aria Operations.
