


Cost Anomaly Detection
Anomaly detection is an automated solution to help you identify unusual activity, also called anomalies, across your cloud accounts within the past 90 days. Anomaly detection categorizes unusual activity into active and inactive anomalies. An active anomaly is defined as a period of unusual activity in progress. An inactive anomaly is past occurrence of unusual activity.
To get started with anomaly detection, go to Governance > Anomaly Detection.
Cost anomaly detection can help you:
- Identify unusual spending across your cloud accounts within the past 90 days.
- Identify an increase or sudden decrease in cost and usage, and make informed decisions.
- Reduce the cost impact of the anomaly by acting when an anomaly is first detected.
- Review past anomalies to determine what caused them.
- See the cost impact to your accounts from anomalies.
- Create service, region or marketplace specific cost anomaly alerts.
You can also create policies to alert you when the cost impact of anomalies exceeds the specified threshold. When building the policy, select AWS anomaly, GCP anomaly, or Azure anomaly as the resource type. For more information on creating policies, see Build a Policy That Sends Notifications.
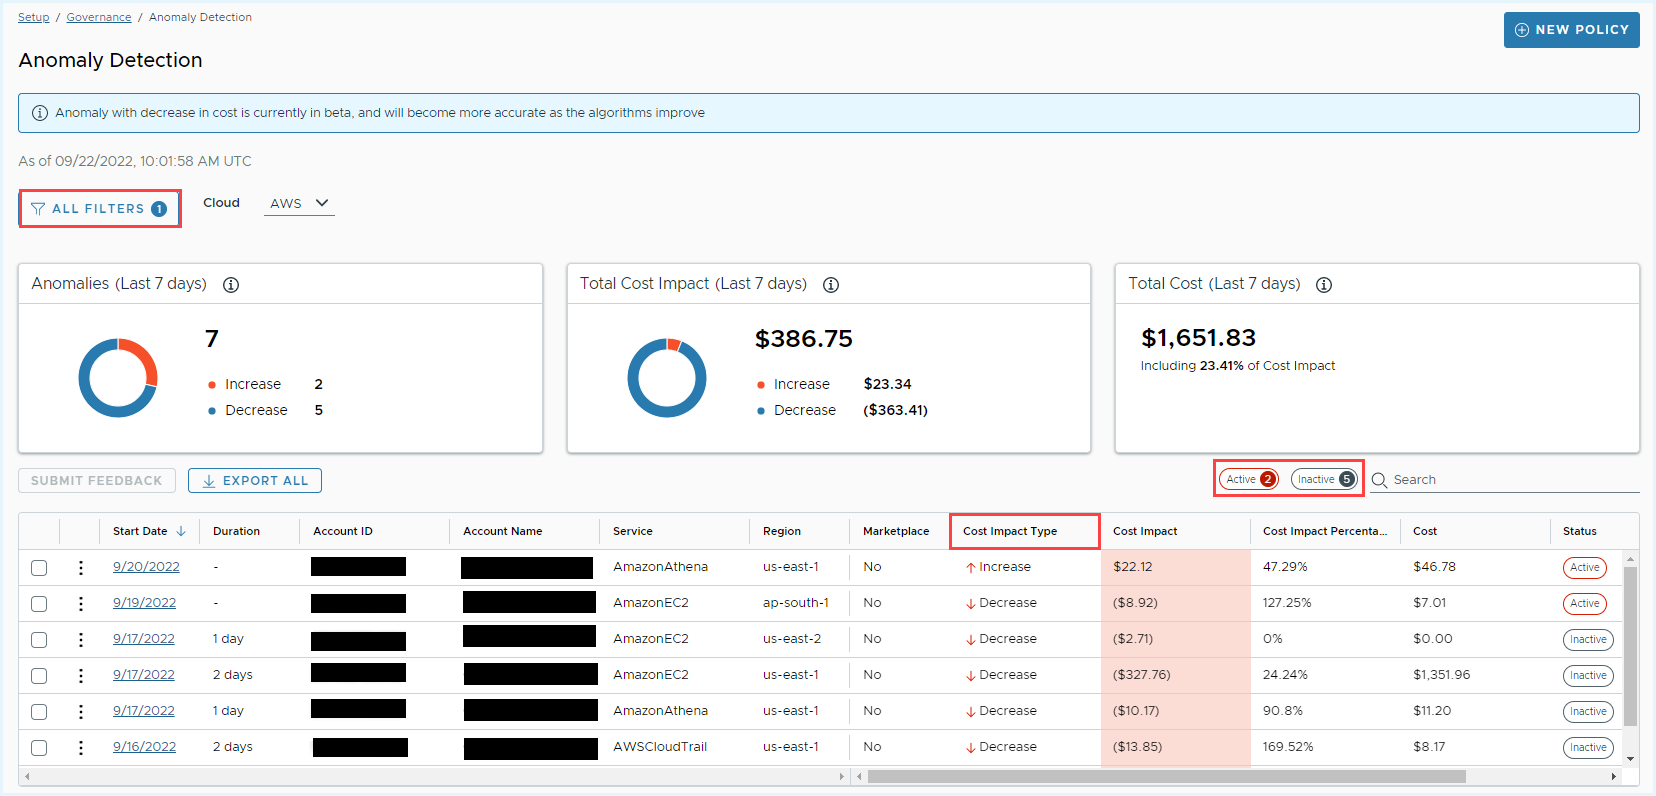
Using the Anomaly Dashboard
The dashboard provides the following information:
- A high-level view of the total number of anomalies
- The total cost impact of the anomalies
- The total cost of the cloud spending for the accounts that are displayed in the dashboard
Total cost is the total cloud spending for accounts displayed in the dashboard for the selected time. For example, the total cost of all accounts over the last 30 days in the us-east-1 region was $500. The total cost includes the total cost impact, which is the amount spent because of the anomaly. If your average spending in those accounts over 30 days is typically $200, then the cost impact on the account because of the anomaly is $300.
- The anomaly dashboard shows only anomalies associated with your current organization. To view anomalies for a specific organization or for a FlexOrg, use the organization changer at the bottom left of the platform.
- By default, the anomaly dashboard shows only increased anomaly details. From All Filters, select the Cost Impact Type of your interest to view the specific cost details in the dashboard.
Filter Anomaly Data
You can filter the dashboard to view only anomalies that:
- Are associated with a specific provider.
- Meet specific account criteria.
- Occurred within a specific time period.
- Are associated with a marketplace cost.
- Are associated with a specific cost impact type.
- Had a specific cost impact.
Further, you can narrow your search results by selecting multiple combinations of cost impact “value” and “percentage”. For example, you can filter values based on conditions such as “cost impact greater than 80%” AND “cost impact greater than $100”.
After you filter the dashboard, the anomaly statistics and list of accounts update to reflect your search parameters. Based on your selection of Cost Impact Type, the dashboard displays the data on summary cards. You can use the Active and Inactive buttons to filter anomalies by activity status. You can also search the filtered accounts table to find a specific account by cloud-specific account values. Use the horizontal scroll bar at the bottom of the table to view cost impact details in terms of value, percentage, and status.
Save and Subscribe Anomaly Report
On the Anomaly Detection page, by using the available Filters option, you can create a custom cost anomaly report.
- Select your preferred Cloud from the dropdown and apply the necessary Filters.
- Click the Actions dropdown at the top right corner, and click Save As.
- Enter a name and description and select who can have access to the report.
- Click Confirm.
To access and subscribe to your saved report, navigate to the Reports > Saved Reports page.
- Find the report you created and click the report name. The report opens on the screen.
- Click the Subscribe > New Subscription from the top-right corner.
- Configure the subscription details and click Subscribe.
The Subscribe option is also available by clicking the vertical ellipses icon against the report name.
For more information, see Actions and Subscriptions.
Submit Feedback About Anomalies
You can submit feedback about one or more anomalies directly from the accounts table, which will help improve the cost anomaly detection algorithm. Select one or more anomalies, select the more options button next to the anomaly detection date, and then select Submit Feedback. If you selected more than one anomaly, the feedback is applied to all selected anomalies and overwrites any existing feedback.
Click Export to download a CSV file of all anomalies displayed with your current filters applied.
Archived Anomalies
Anomalies are archived when billing data from the cloud provider is corrected, and the data may no longer be anomalous. You can view archived anomalies by selecting View Archived Anomalies at the bottom of the dashboard.
Archived anomalies generally do not require any action and are displayed for reference. However, if an anomaly has been archived in error, you can submit feedback for the anomaly indicating that the anomaly was valid.
Using the Anomaly Details Page
Click the date of a specific anomaly in the table to view more details on the Anomaly Details page. On the anomaly details page, you can:
- View anomaly details:
- start and end date
- account
- service
- region
- marketplace
- cost impact
- cost impact type
- whether the anomaly is still active
- View the anomaly on a chart by itself or with other anomalies on the same account
- Submit feedback about the anomaly
- View the cost impact of the anomaly or of all anomalies on the same account
- View the past 90 days’ worth of cloud spending on the account
- View the root cause analysis to see more information about the anomaly in FlexReports
For more info about using FlexReports to identify the root cause analysis, see Using the Root Cause Analysis in FlexReports.
The Total Cost and Anomalies per Day table shows when the selected anomaly happened and the cost of the anomaly. You can change the time period to view the last 7, 14, 30, 60 or 90 days of data. If there were any other anomalies on the account where the specific anomaly occurred, you can also display those anomalies on the same table by enabling the Show Other Anomalies toggle.
The Data View by Anomaly table shows the duration and cost impact of all anomalies on the selected account in the past 90 days, and whether an anomaly is still active.
The Data View by Total Cost table shows the total cost of cloud spending for the account over the past 90 days, including the cost of anomalies.
You can also submit feedback about the anomaly. Providing feedback about the anomaly will help you detect anomalies more accurately as we improve our anomaly detection algorithm. You can change your feedback after it has been submitted by clicking Update Feedback. No sensitive data is captured in your feedback.
Root Cause Analysis in FlexReports
To perform root cause analysis using anomaly data,
- Click the anomaly detection date or select the more options button next to the anomaly detection date and click View Details.
- On the Anomaly Details page, click View Root Cause at the top-right corner.

- Click Create FlexReport to view anomaly data in context with other datapoints.
- Enter a name for your report and click Save & Run Report. To access the saved report click Reports > FlexReports from the left navigation menu.
To use FlexReports more easily to perform a root cause analysis, open the FlexReports page in a new browser tab. For more information about using FlexReports, see Sections in FlexReports.
Use the chart view to identify the anomalous spend. Click the data point on the chart to narrow down the view to just that specific data point. In the table view, you can view additional details about that data point. Use the information to locate the account or service causing the anomaly. For example, you are investigating an anomaly in an AWS account that happened from February 26 to February 27. Clicking on the spike in unblended cost on February 27th in the chart details the services and their cost. You realize that a particular account had a much higher spike in cost and use this information to contact the owner of the account to remediate the anomaly.
Furthermore, you can utilize the Perspective category to pinpoint the exact root cause of the anomalies. For example, if an anomaly is detected for EC2, select Perspective Category and Team Perspective to identify which team is the contributor to this anomaly. This will help you plan and take necessary remedial actions accordingly.

Create a Policy Based on Anomaly Data
Create a policy that monitors anomaly data and sends a notification when an anomaly meets certain conditions.
You can create policies to alert you when the cost impact of anomalies exceeds the specified threshold. For detailed information about creating policies, see Build a Policy That Sends Notifications.
To build a policy based on anomaly data:
- From the anomaly detection dashboard, click New Policy.
- Name your policy and write a brief description of what the policy monitors.
- Add one or more policy blocks and select AWS anomaly, GCP anomaly, or Azure anomaly as the resource type.
- Set the conditions for the policy.
For example, to build a policy that sends a notification when the cost impact of active anomalies in your Engineering AWS account is over $500 in a week:
- Select AWS anomaly as the Resource Type.
- In the condition builder, select Cost as the topic, then build the condition as follows: When the cost impact of active anomalies is greater than 500 dollars updated in the last 7 days when Accounts is Engineering
